Analytics
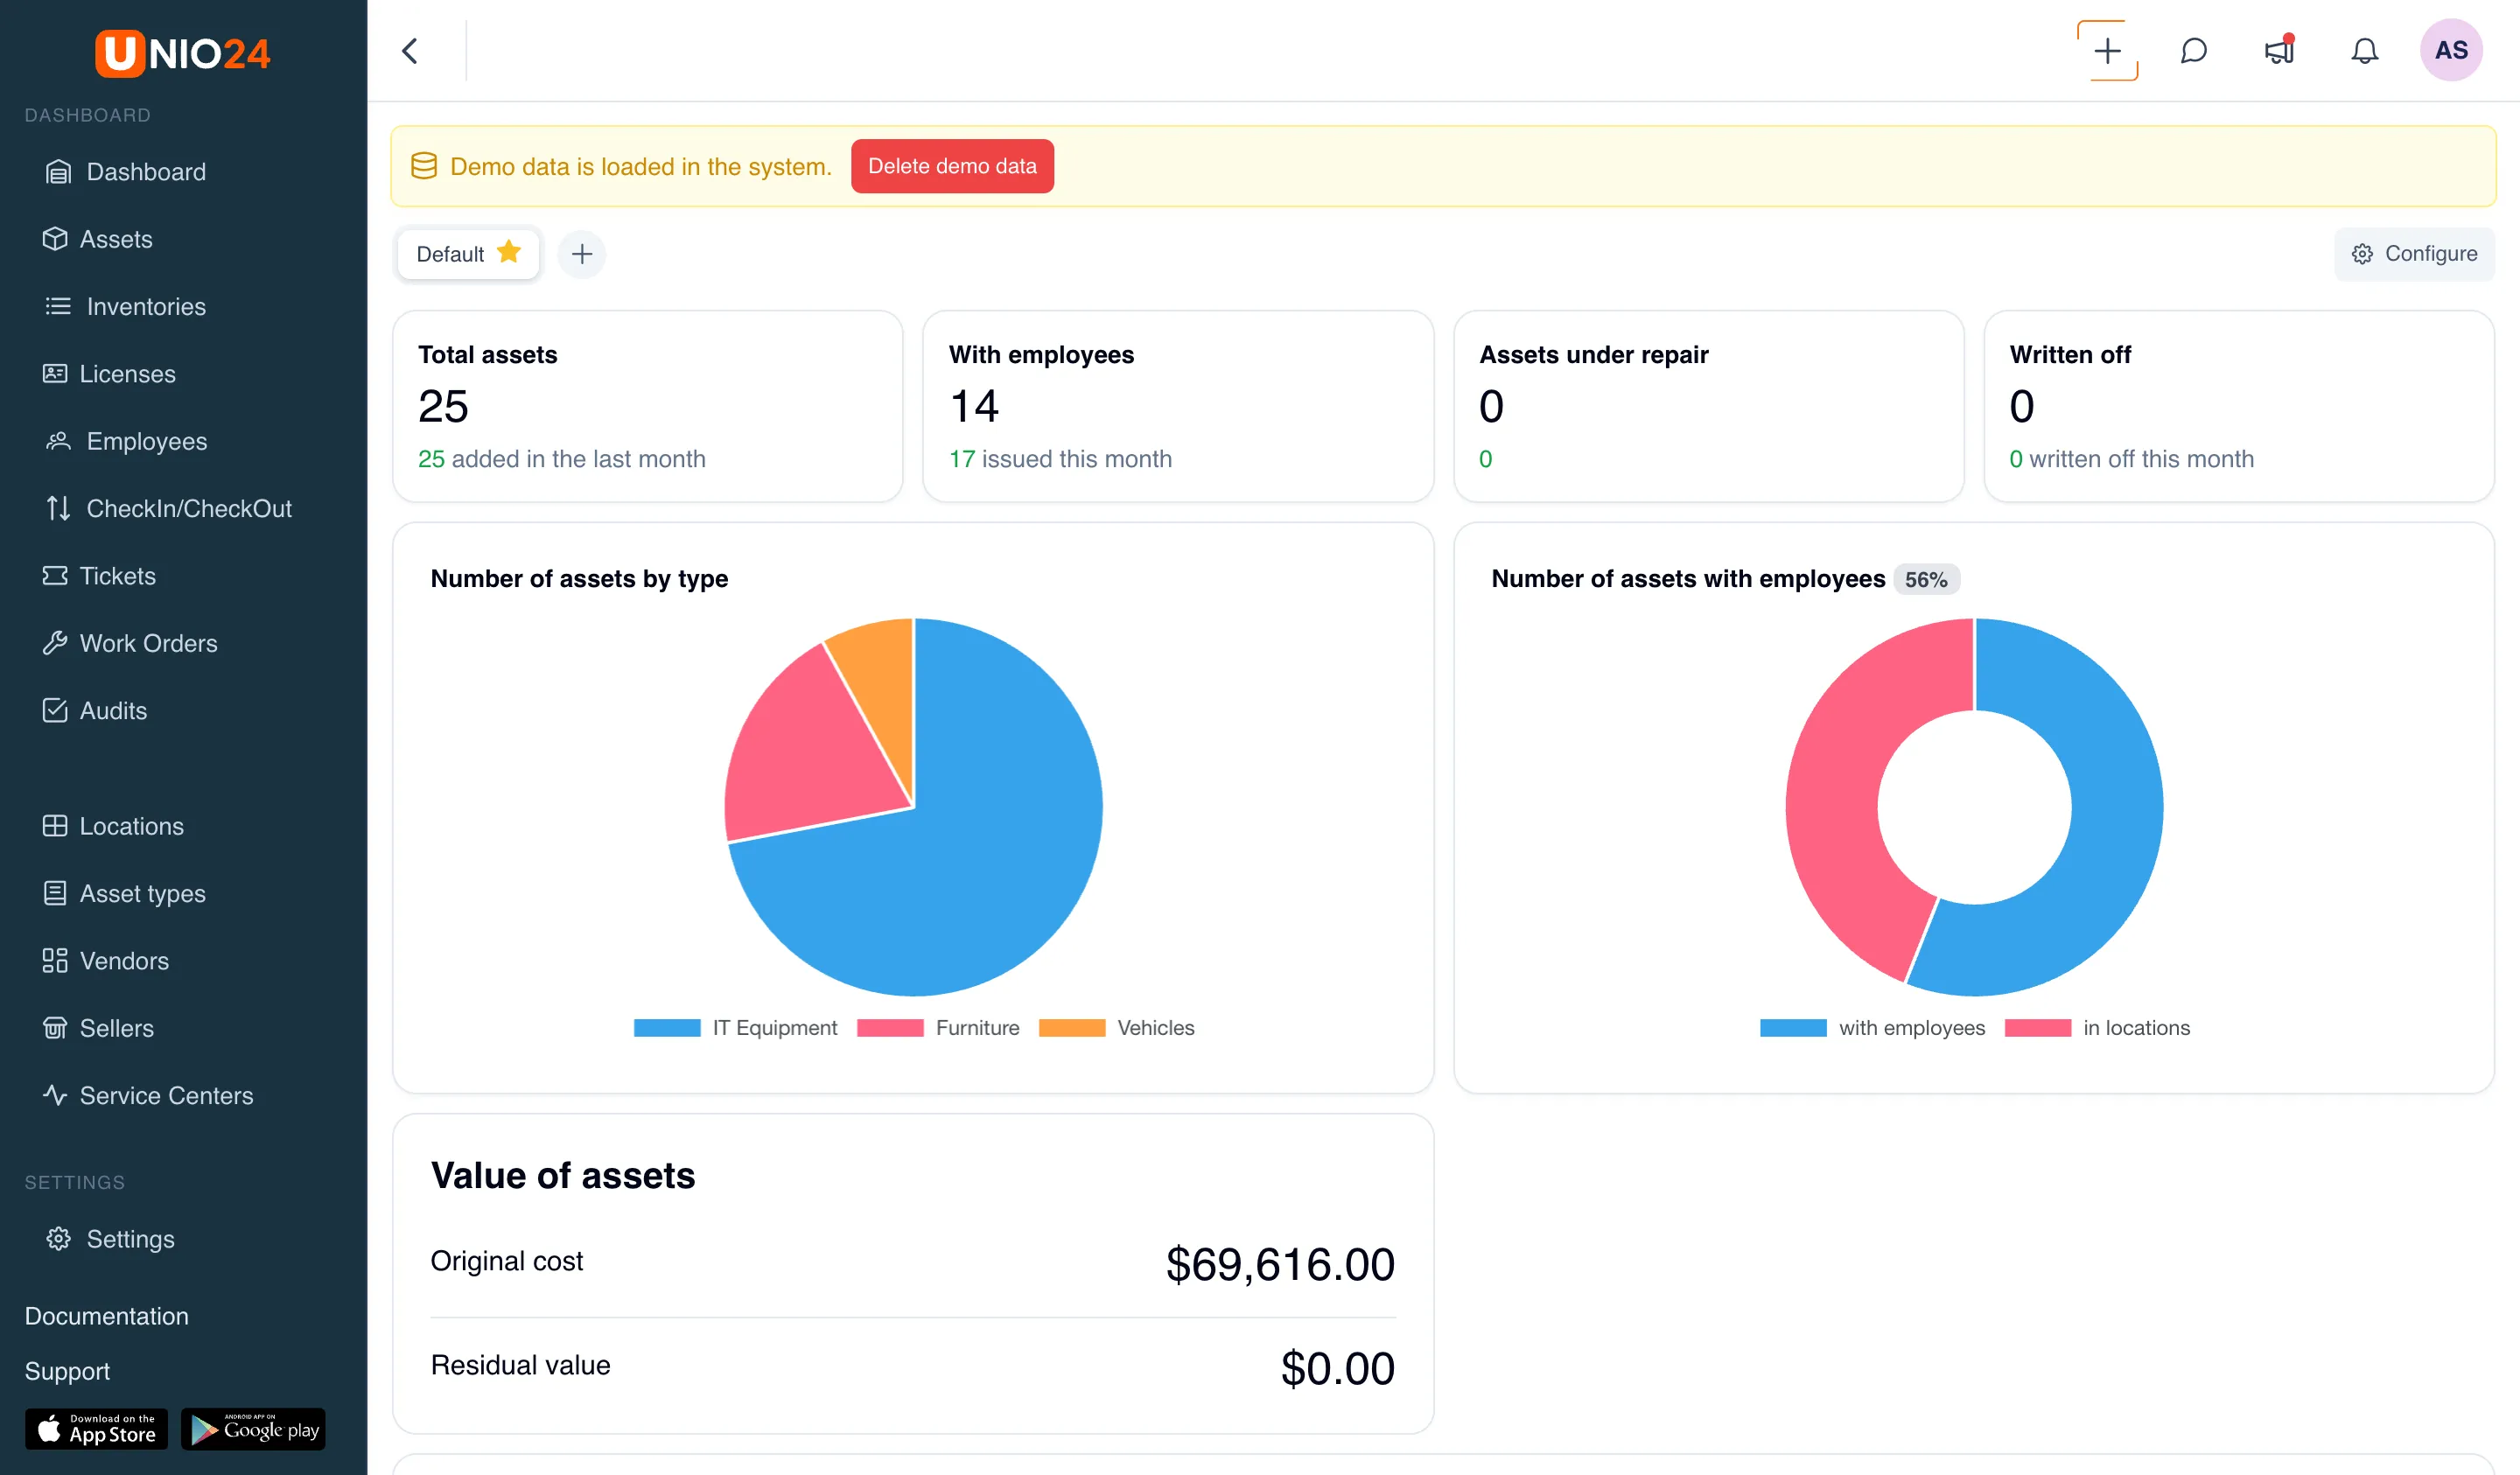
Analytics is the landing screen that opens right after you sign in. It is a customizable dashboard: you assemble it yourself from widgets — tiles with numbers, charts, and lists — and you can keep several different dashboards for different tasks.
Widgets let you see the state of your records on one screen without opening each section separately. Counters show key numbers — how many assets there are in total, how many are with employees, how many are under repair or written off. Charts show distributions: by asset type, by employee, and by location. Lists surface what needs attention: assets overdue for return, expiring licenses, recent activity. By assembling a dashboard from the widgets you need, you keep the metrics that matter to your work in front of you.
Multiple dashboards
Section titled “Multiple dashboards”A dashboard control bar runs across the top of the page. On the left is a switcher styled as a row of tabs with dashboard names: the current one is highlighted, and the default dashboard has a star. By default there is one dashboard (Default), but you can create others — for example, a separate one for assets and a separate one for maintenance.
Next to the switcher are:
- the + button (tooltip New dashboard) — creates a dashboard: enter a Dashboard name and click Create;
- the ⋮ button (three dots) on the current dashboard — opens a menu with Set as default (this dashboard will open first) and Delete dashboard.
To switch to another dashboard, click its tab.
Configuring the dashboard
Section titled “Configuring the dashboard”You change the set and arrangement of widgets in configuration mode.
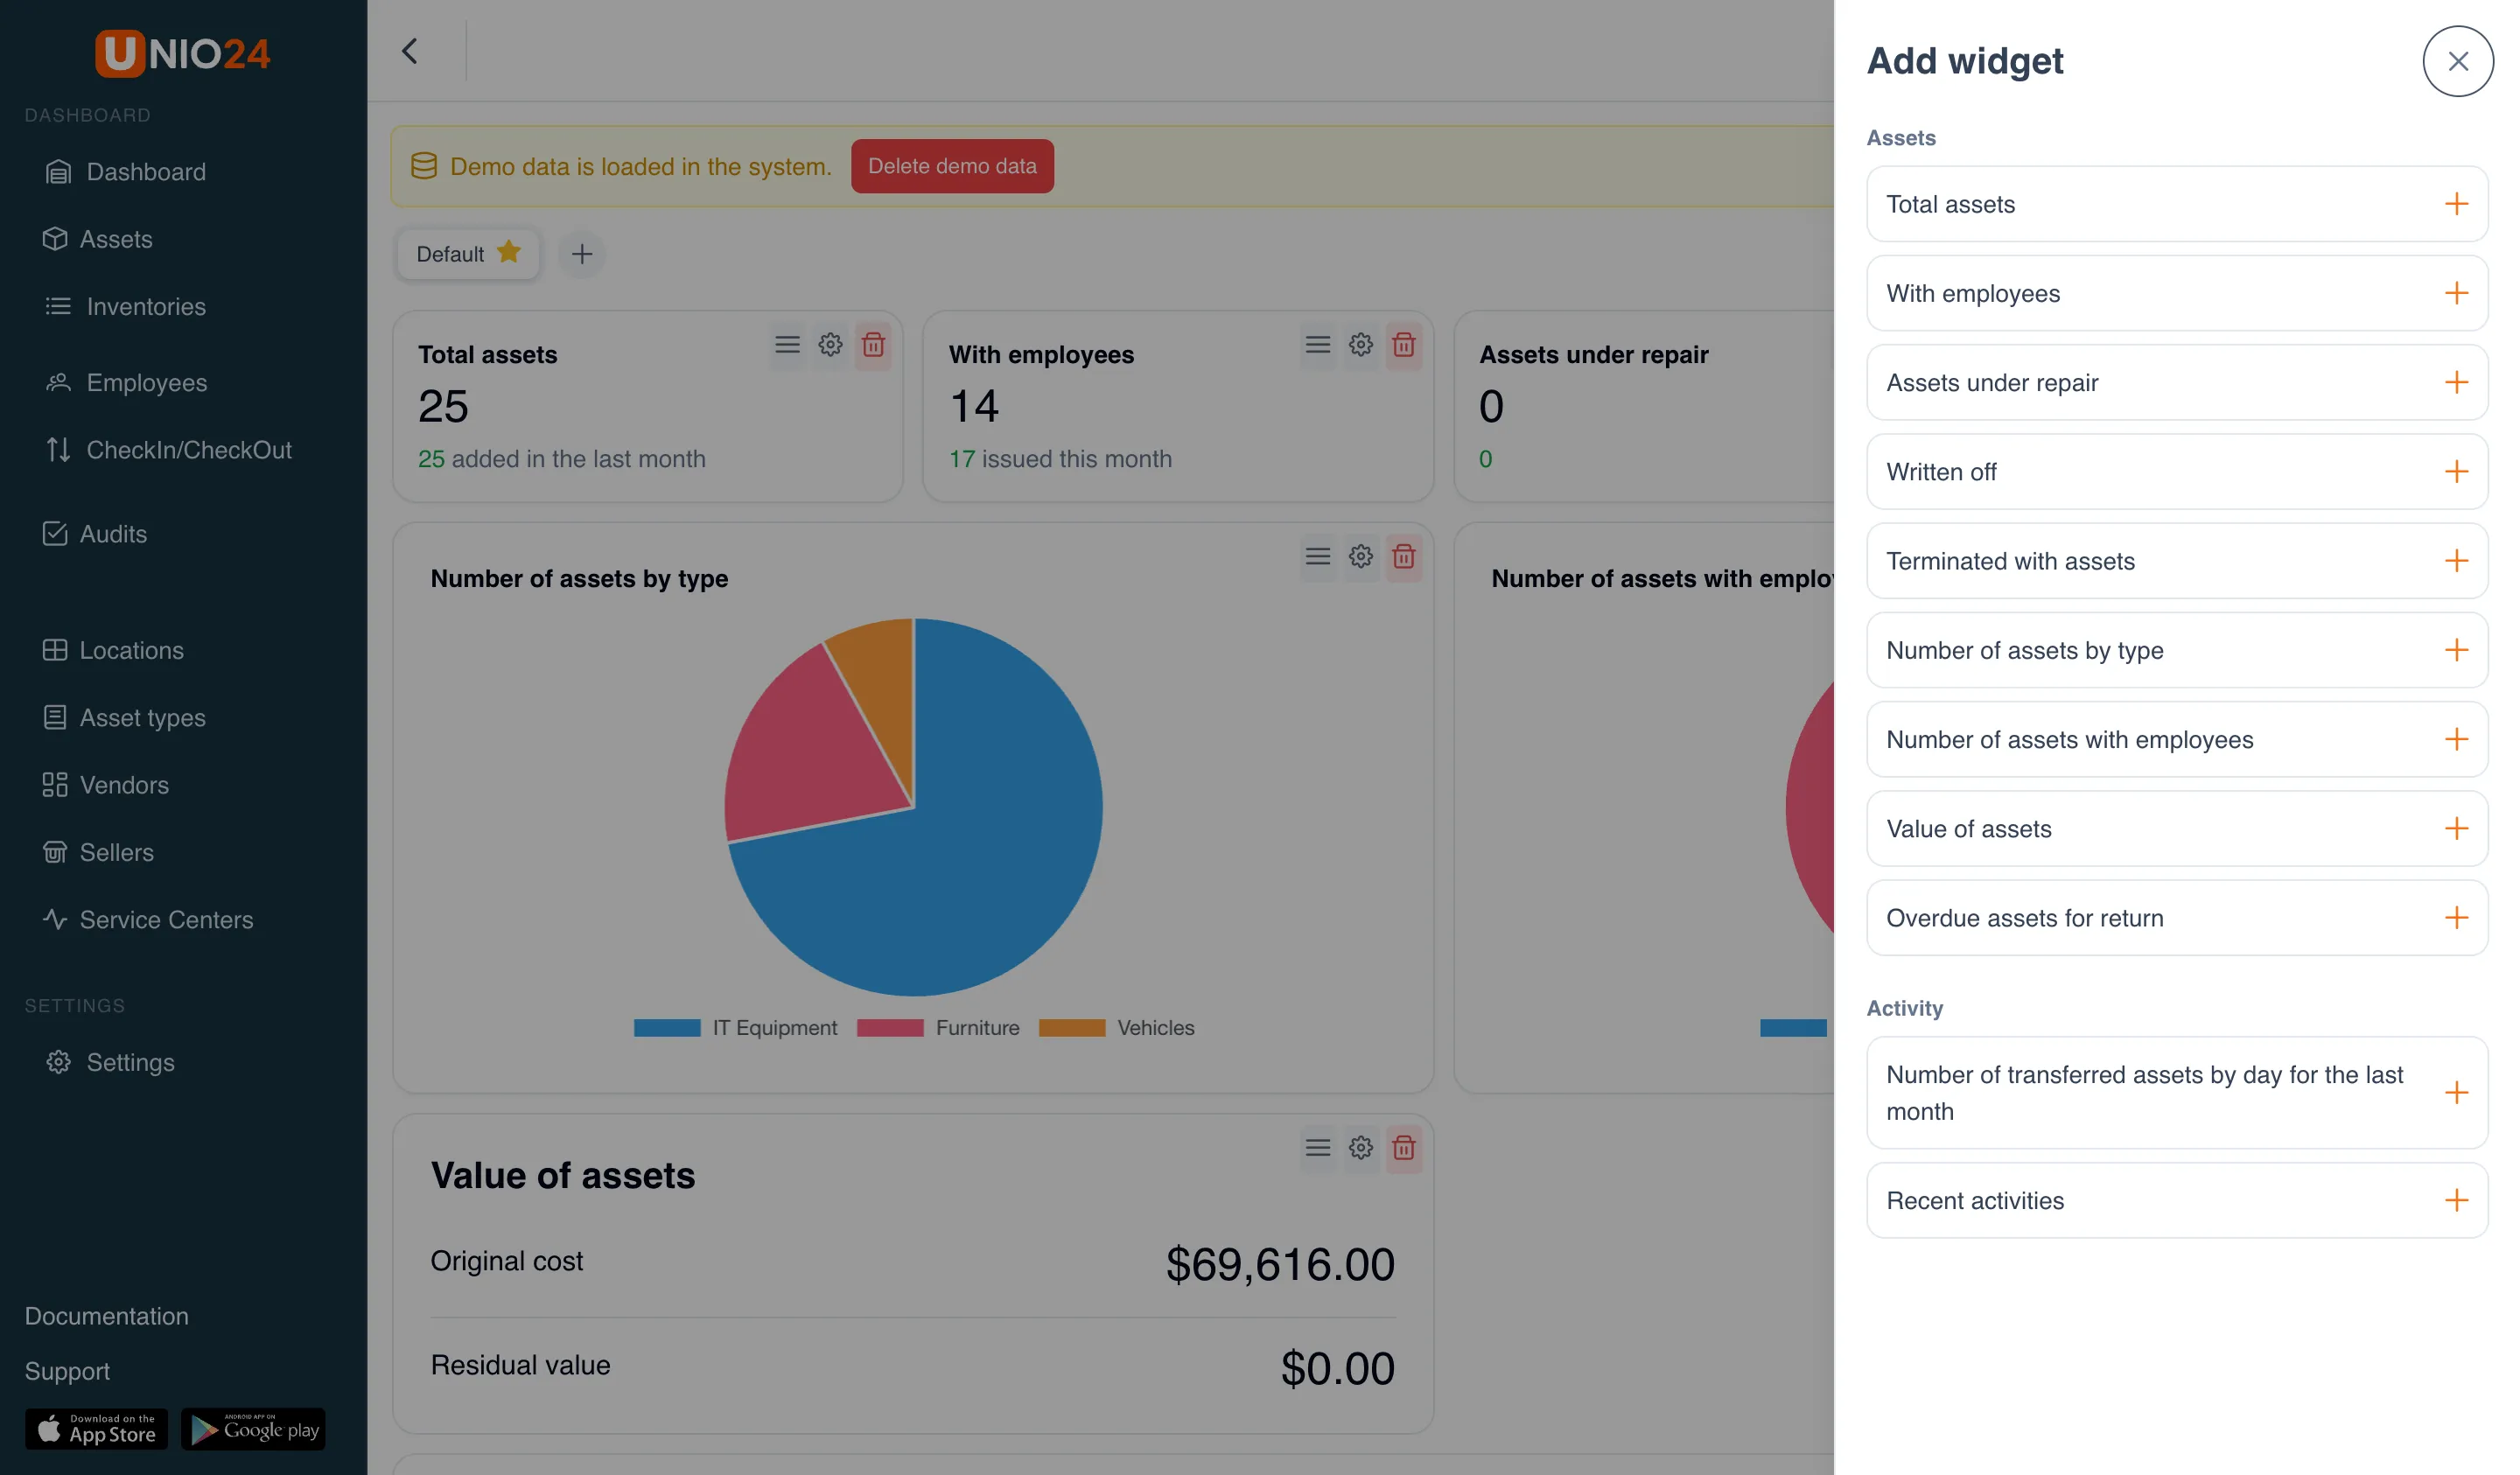
- Click Configure — the button on the right of the dashboard control bar. The Add widget, Cancel, and Save buttons appear.
- Click Add widget — the catalog of available widgets opens. Select the ones you need.
- Drag widgets to change their order.
- Set each widget’s width in grid columns (from 1 to 4).
- Click Save (or Cancel to discard the changes).
If a dashboard has no widgets yet, it shows the hint This dashboard is empty — Click “Configure” then “Add widget” to start.
Widget settings
Section titled “Widget settings”Each widget has its own settings (Widget settings):
- Visualization — how to show the data: Counter, Pie, Doughnut, Bar, Line, List, or Table (the available options depend on the widget).
- Width (columns) — how many grid columns the widget takes up.
- Period — for charts: 7 days, 30 days, 90 days, or 12 months.
- Rows — for tables: how many rows to show.
- Visibility — Always show or Only when there is data.
After making changes, click Apply. You can remove a widget with Remove widget.
Widgets set to Only when there is data appear on the dashboard only when there is something to show (until then they display the Appears when there is data note). A widget that depends on a disabled module is marked Unavailable — its module is turned off.
Widget catalog
Section titled “Widget catalog”Widgets are grouped into the Assets and Activity categories. The available set depends on which modules are enabled.
Key metrics (counters)
Section titled “Key metrics (counters)”- Total assets — the total number of assets; below the number is how many were added in the last month.
- With employees — assets assigned to employees; below the number is how many were issued this month.
- Assets under repair — assets in maintenance.
- Written off — assets pending disposal; below the number is how many were written off this month.
- Terminated with assets — terminated employees who still hold assets (see Offboarding employees).
Charts
Section titled “Charts”- Number of assets by type — the distribution of assets by type.
- Number of assets with employees — how assets are split between employees and locations.
- Value of assets — the original cost and the residual value of assets (two sums).
- Number of transferred assets by day for the last month — transfer dynamics by day.
Lists and tables
Section titled “Lists and tables”- Recent activities — the latest asset operations (date, time, action, asset, inventory number).
- Overdue assets for return — assets that are past their planned return date.
- Expiring licenses — licenses approaching the end of their term. The widget is available only when the Licenses module is enabled; each entry shows how many days are left.
Getting-started card and feedback
Section titled “Getting-started card and feedback”For new accounts, the home page shows a Getting started card with the basic setup steps (create an asset type, add an asset, add an employee, and so on) and a progress indicator. You can hide the card with Close widget.
You can reach the team right from here with the Write to us button. It opens a Feedback form where you pick a Category (Bug, Feature request, Question, or Other), enter a Message, and click Send.