

Fleet deadlines and analytics
Two fleet pages help you keep the fleet under control: Deadlines shows what vehicles and drivers are due for and what is already overdue, and Analytics shows what the fleet costs and how available and busy it is. Companies in the United States and Canada also get the quarterly IFTA report. The same data can be put on the dashboard as widgets.
Deadlines
Section titled “Deadlines”The Fleet → Deadlines page is a calendar of everything that is due by a date. You don’t enter anything here: rows are collected from other sections and disappear on their own once the work is done, such as maintenance performed, a document renewed, a license check recorded, or a fine paid.
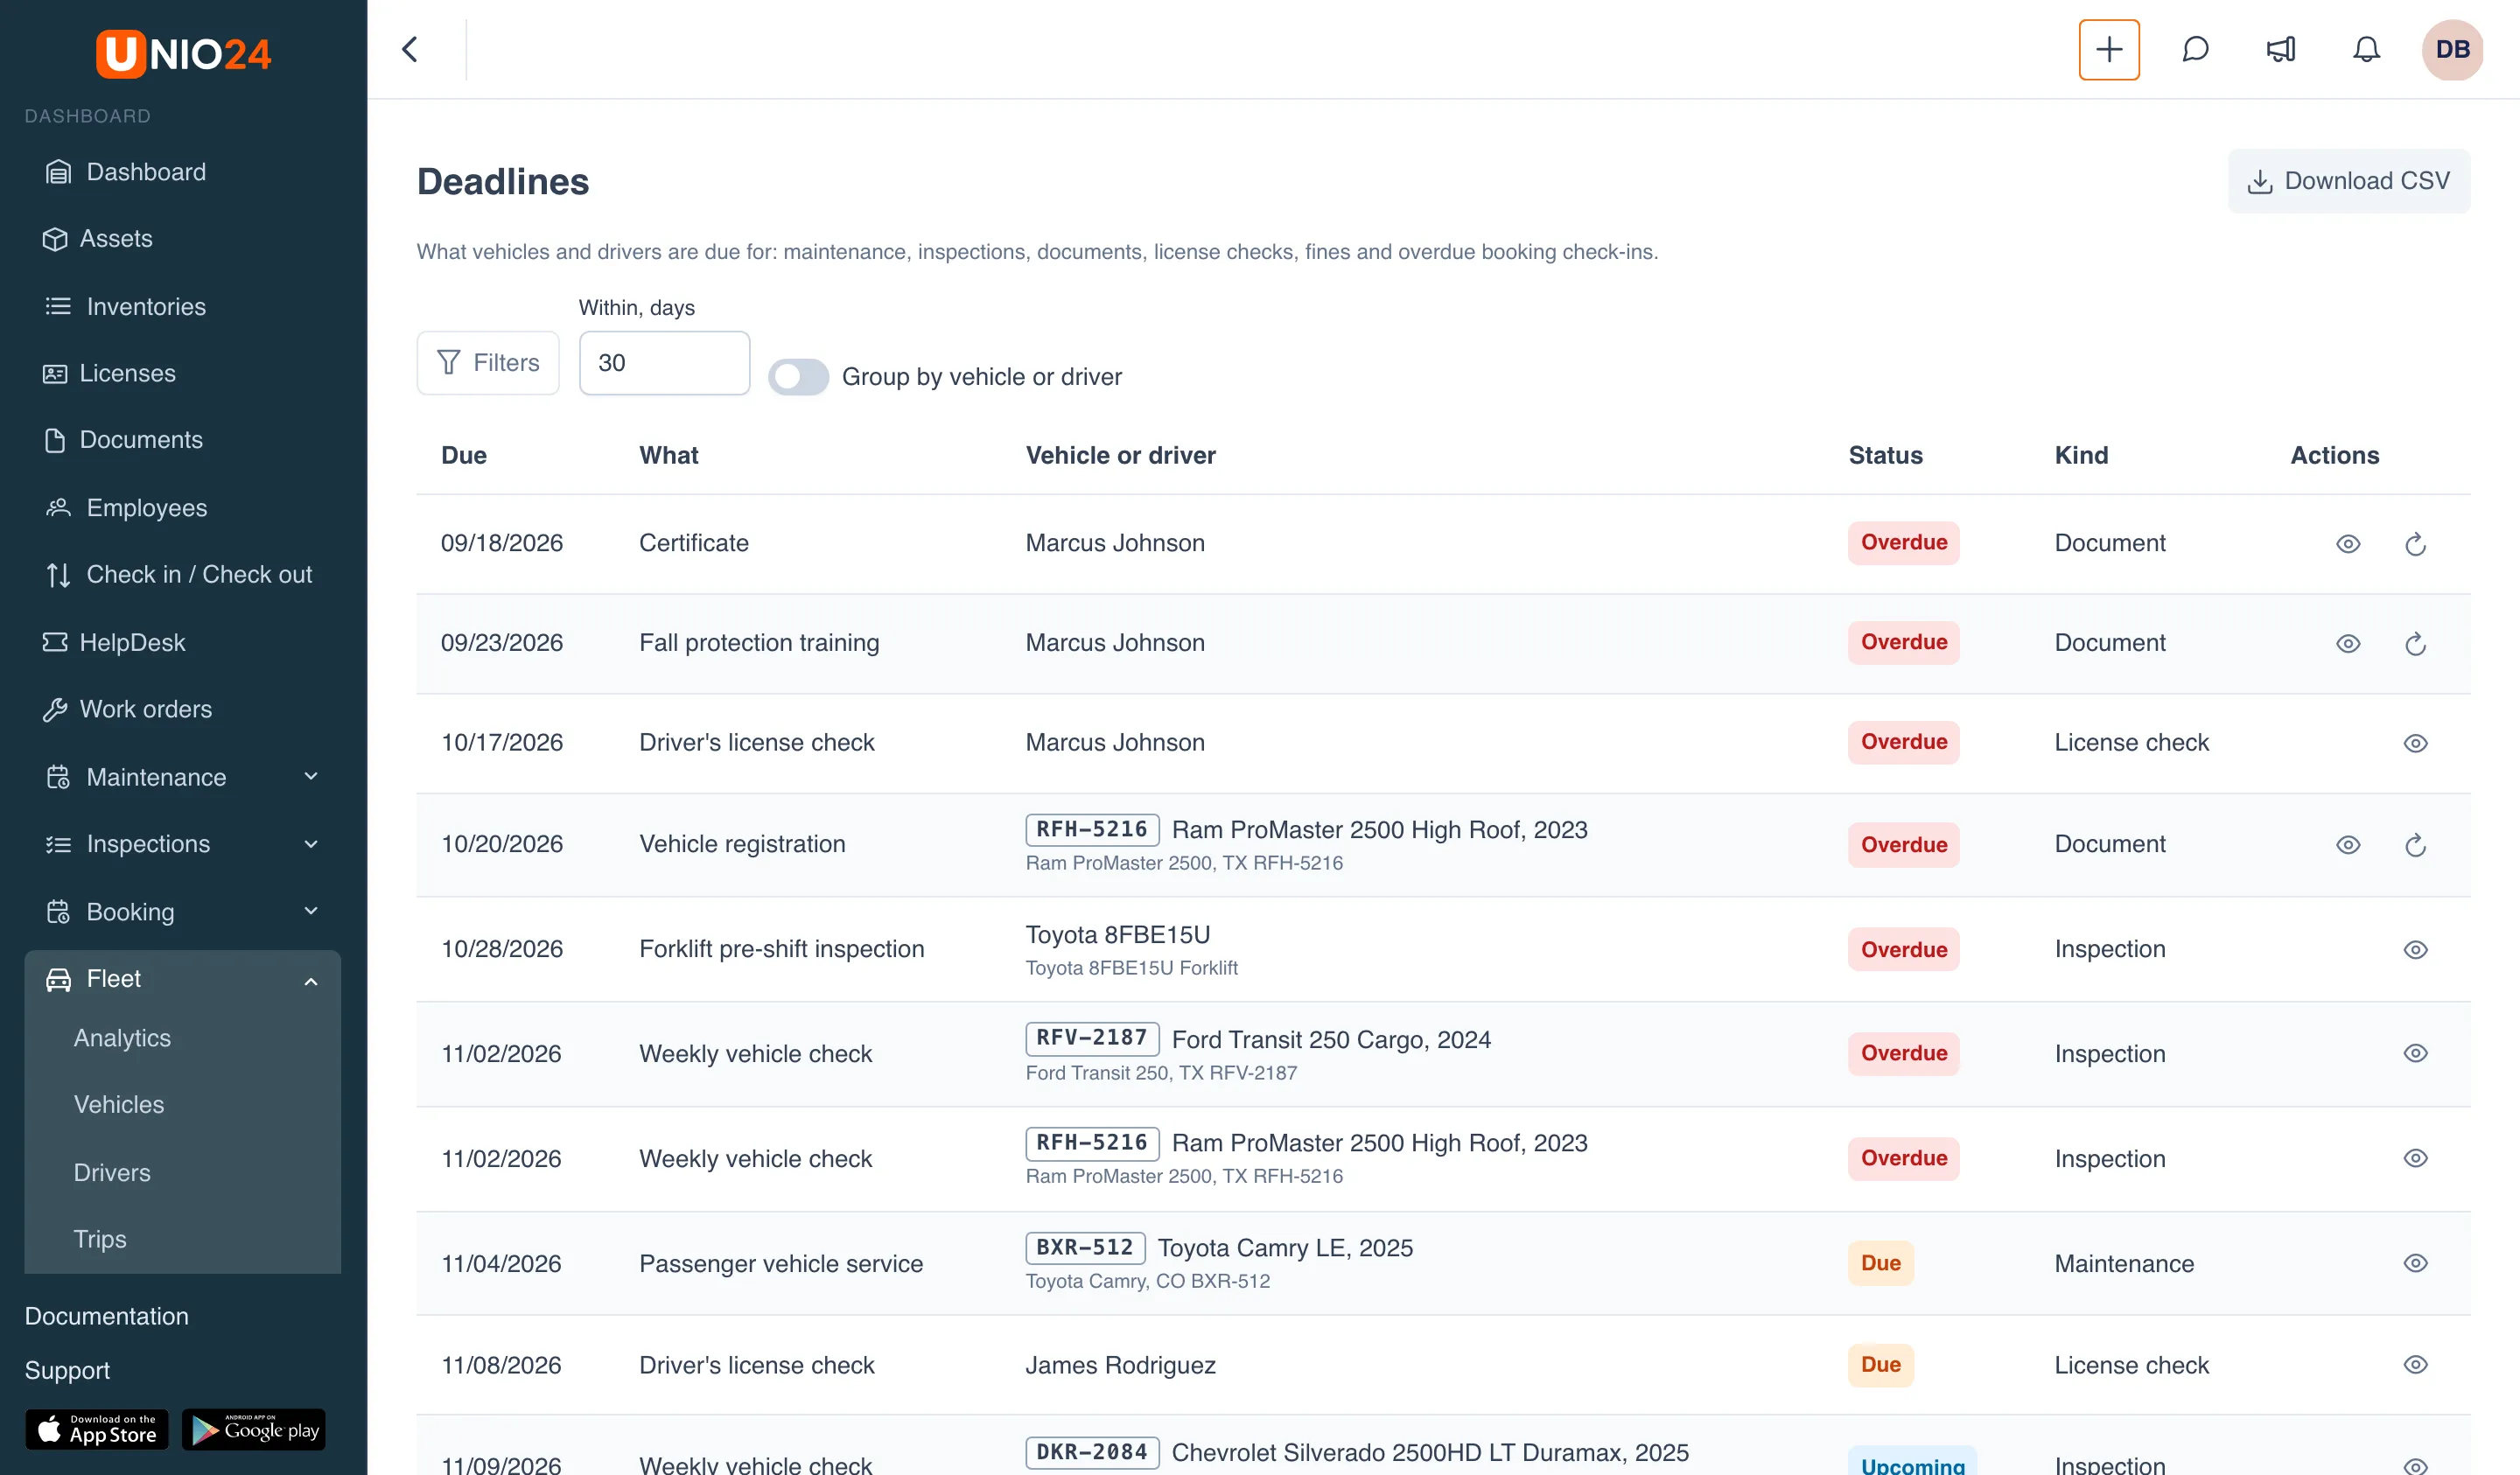
What goes into the deadlines
Section titled “What goes into the deadlines”| Kind | Where the row comes from | Whose row |
|---|---|---|
| Maintenance | The vehicle’s maintenance schedules | Vehicle |
| Inspection | The vehicle’s inspection schedules | Vehicle |
| Document | Documents of the vehicle (insurance, registration) and of the driver (driver’s license, medical card, and other employee documents) | Vehicle or driver |
| Booking check-in | A booked vehicle wasn’t checked in on time (only when booking is on) | Vehicle |
| License check | The date of the driver’s next license check | Driver |
| Fine | An unpaid fine: the deadline is the last day of the discount while it applies, otherwise the payment deadline | Vehicle |
Rows are sorted by deadline, earliest first. Which kinds of rows you see depends on the modules that are on: without the Maintenance module there are no maintenance rows, and without booking there are no booking check-in rows.
Statuses
Section titled “Statuses”- Overdue: the deadline has passed.
- Due: the deadline is close. For license checks and fines, that’s within the next 7 days; for maintenance, inspections, and documents, it follows the rules of their module (for example, a document expires within the reminder period of its type).
- Upcoming: the deadline is further away, but within the chosen number of days.
Find the deadlines you need
Section titled “Find the deadlines you need”- Open Fleet → Deadlines.
- In the Within, days field, set how far ahead to look: 30 days by default, up to 365. Overdue rows are always shown.
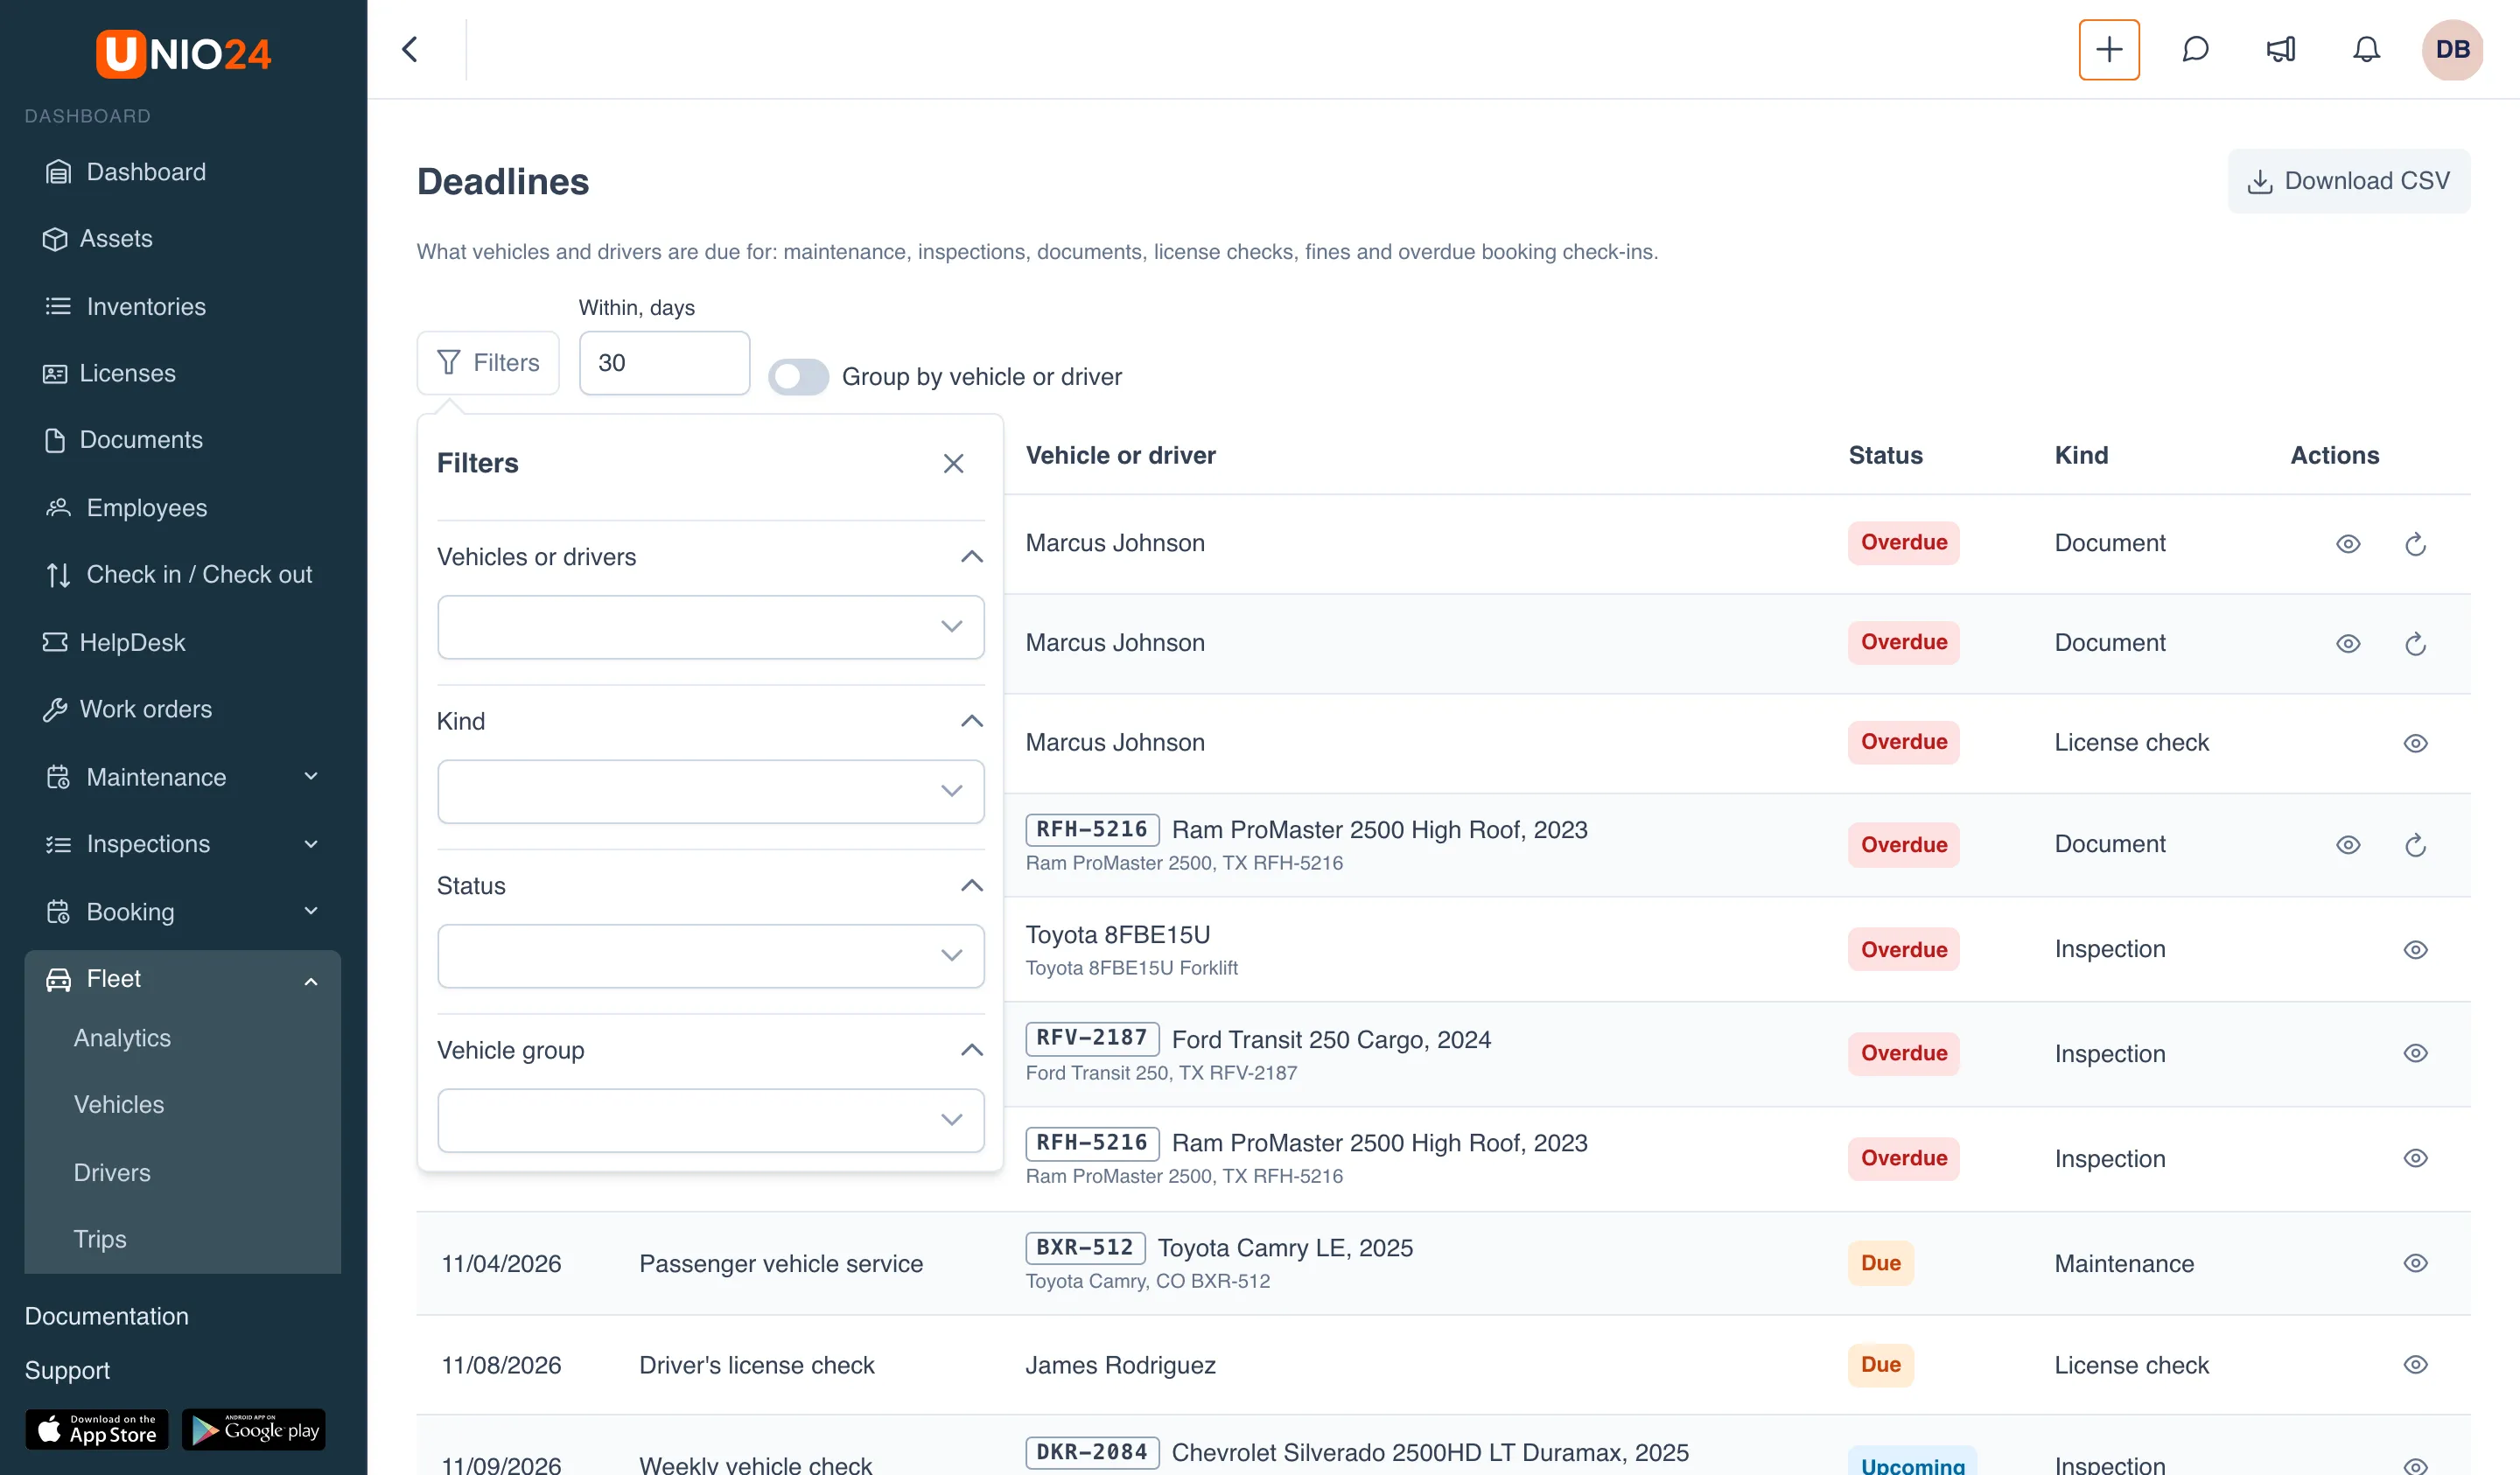
- Click Filters and choose what you need:
- Vehicles or drivers: only vehicle rows or only driver rows;
- Kind: for example, only Fine or only Document;
- Status: Upcoming, Due, or Overdue;
- Vehicle group: vehicles of one group and its subgroups. Drivers aren’t part of vehicle groups, so their rows are hidden while a group is chosen.
- To see the deadlines of each vehicle and driver together, turn on Group by vehicle or driver.
Row actions
Section titled “Row actions”- Open the vehicle or Open the driver: the card of the vehicle or driver the deadline belongs to. Clicking the row does the same.
- Renew: on document rows. It opens the new document form with the vehicle or driver and the document type already chosen. The new document replaces the current one, and the row leaves the deadlines. You see this action if you can view and manage documents of that kind (for driver documents, employee documents).
- Open booking: on booking check-in rows; the booking card opens over the page.
After you save a document or change a booking, the table refreshes on its own.
Download the deadlines as CSV
Section titled “Download the deadlines as CSV”Click Download CSV. The file contains the same rows that are on the screen, with your filters and number of days. The columns are “Subject”, “Name”, “Plate number”, “Kind”, “What”, “Due date”, “Due at meter”, and “Status”. The file opens in Excel as is.
Who sees what
Section titled “Who sees what”The Deadlines page is visible to anyone with at least one of these permissions: “View vehicles, fuel entries and trips”, “Manage vehicles”, “Manage drivers”, “View fines”, “Manage fines”. Rows are shown by section:
- vehicle rows: with “View vehicles, fuel entries and trips” or “Manage vehicles”;
- driver rows: with “View vehicles, fuel entries and trips” or “Manage drivers”. Everyone who sees drivers sees the driver’s license, while other employee documents (for example, a medical card) are visible only to those who also have “View employee documents” or “Manage employee documents”;
- fine rows: with “View fines” or “Manage fines”.
For example, a role with only “Manage fines” sees nothing but fines on this page.
Analytics
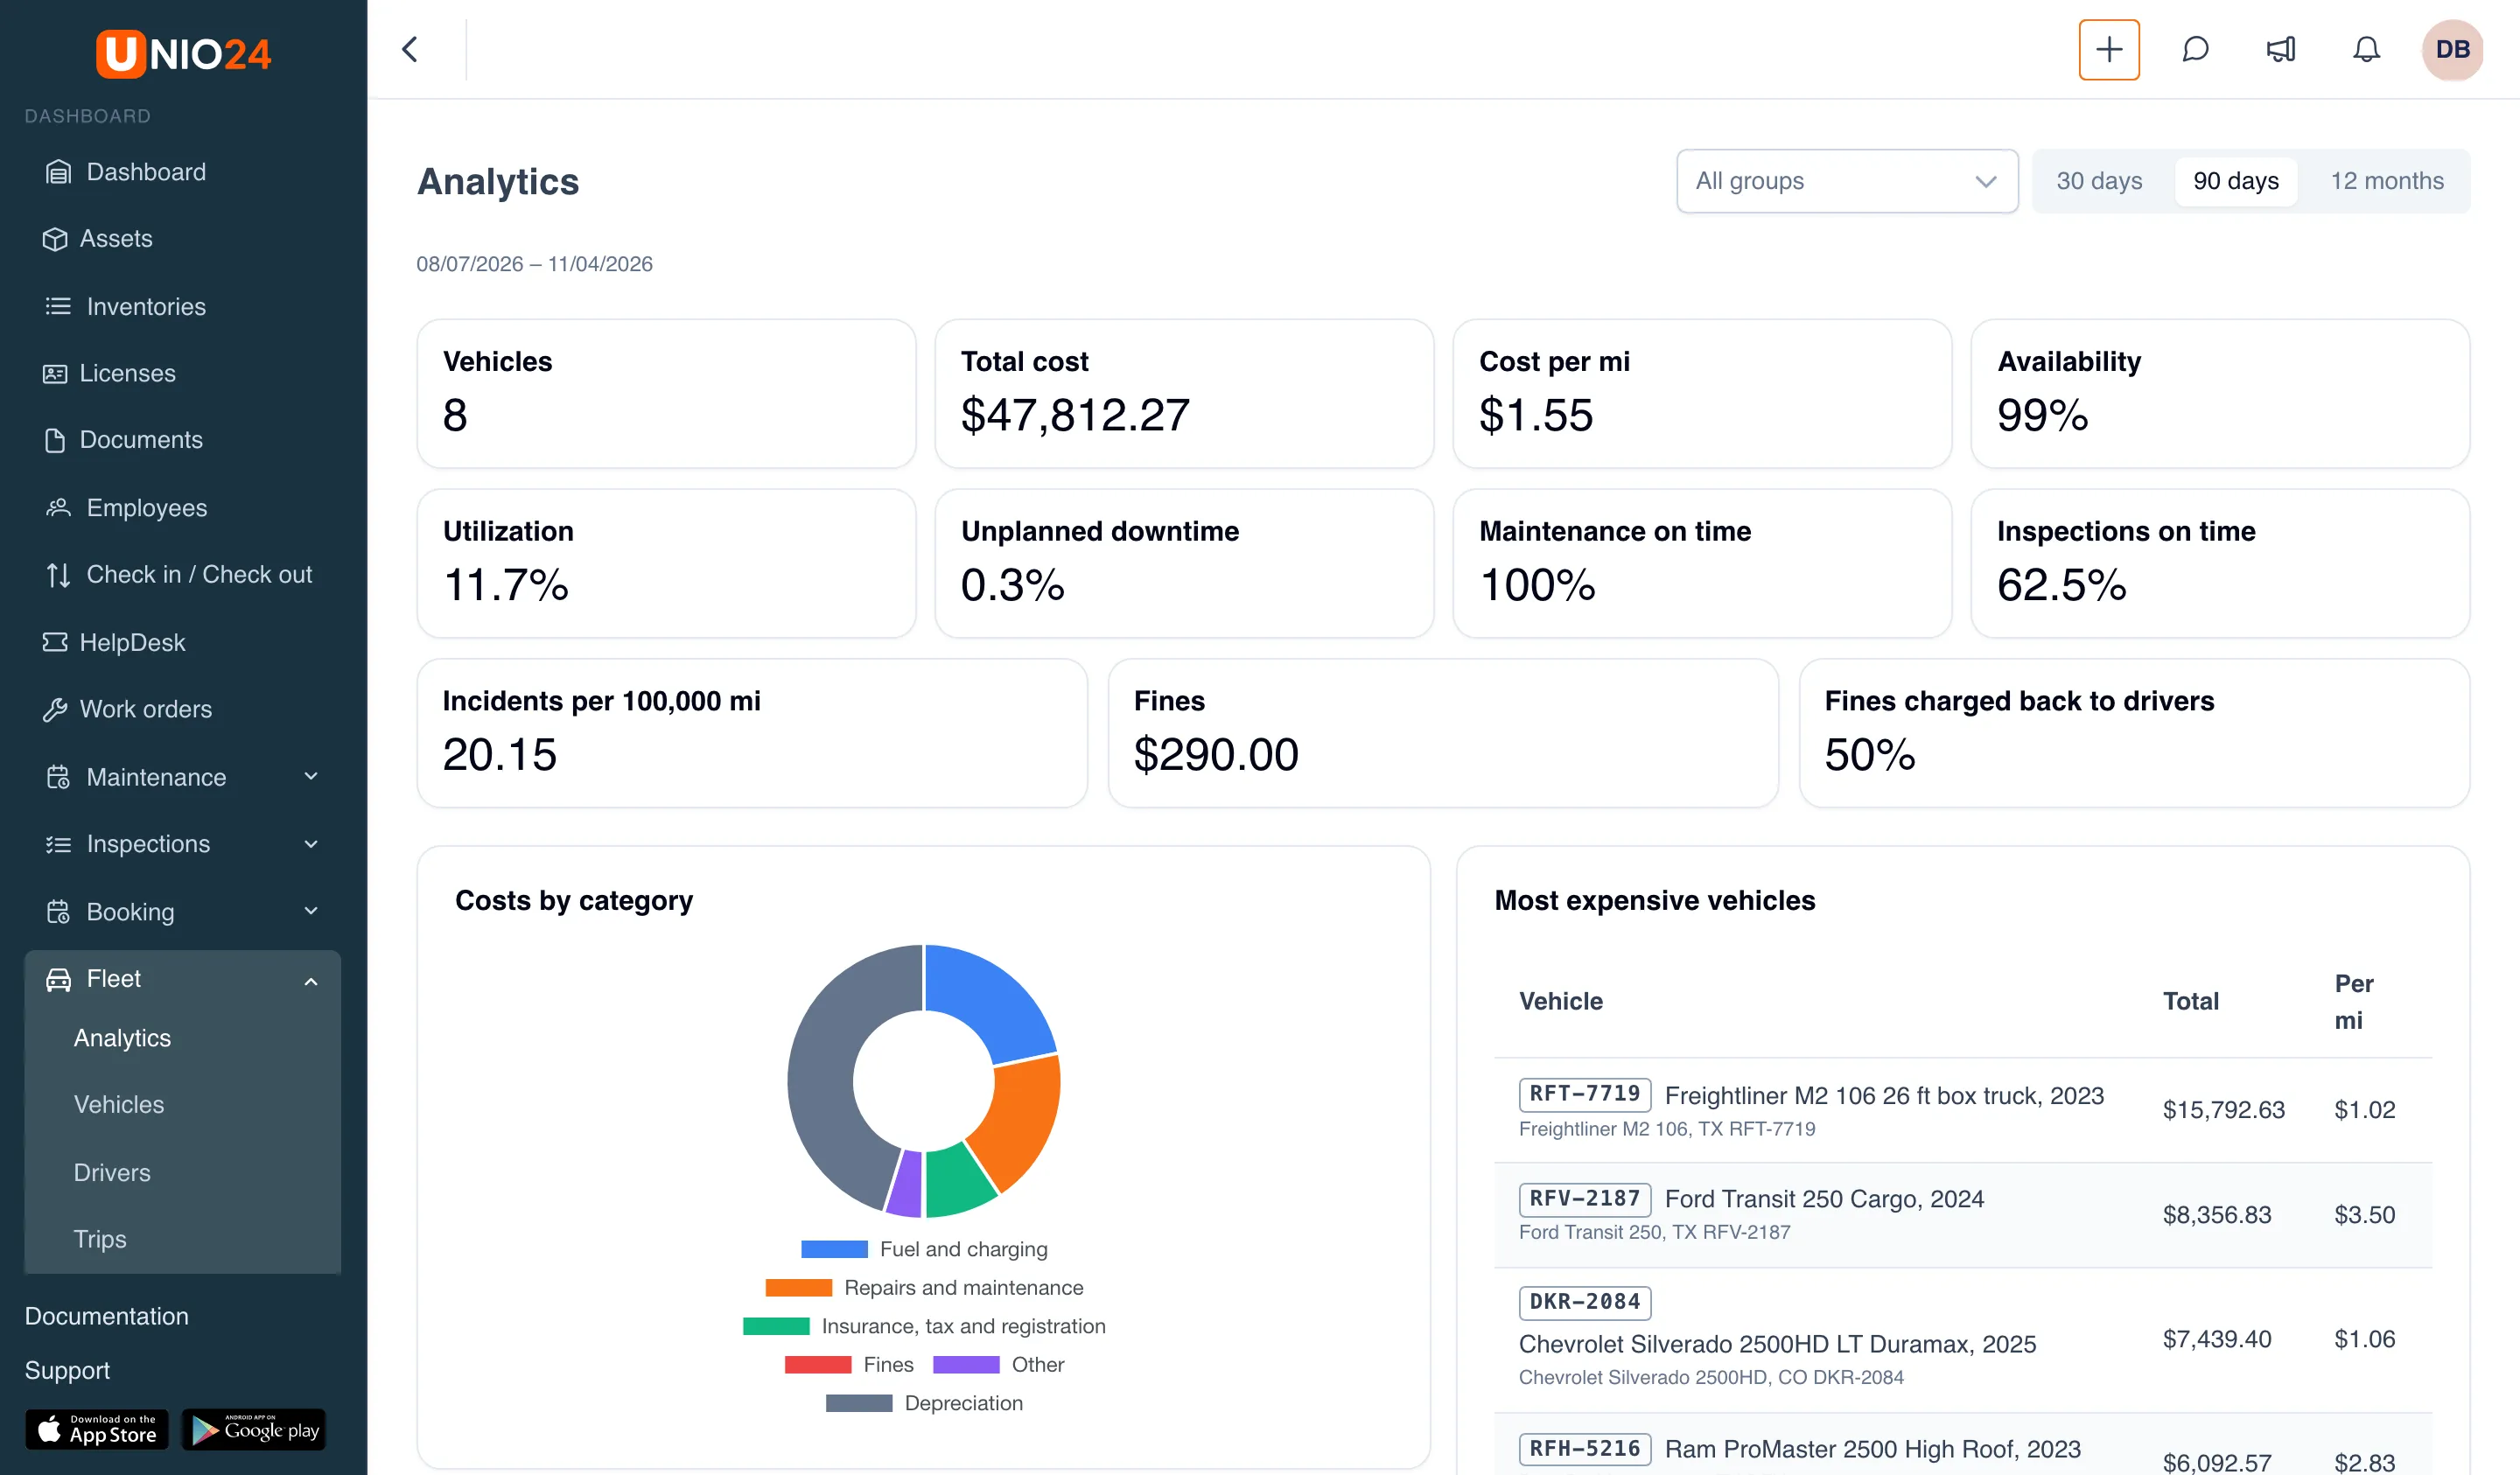
Section titled “Analytics”The Fleet → Analytics page collects metrics for the whole fleet over a period. It’s visible to users with the “Analytics” permission in the Fleet group of the role editor.
- Open Fleet → Analytics.
- Choose the period at the top right: 30 days, 90 days, or 12 months. The period’s dates are shown under the title.
- If needed, choose a vehicle group in the All groups list: the metrics are recalculated for the vehicles of that group only.
Metrics
Section titled “Metrics”| Tile | What it shows |
|---|---|
| Vehicles | How many vehicles are in the selection. Written-off vehicles aren’t counted |
| Total cost | All fleet costs for the period in the company currency: fuel and charging, repairs and maintenance, insurance, tax and registration, fines, other expenses, and depreciation |
| Cost per mi | Total cost divided by the distance driven (per km for companies that use kilometers). Equipment with an engine hours meter isn’t included |
| Availability | The share of time the vehicles were Active |
| Utilization | The share of their Active time the vehicles spent on trips or checked out on bookings |
| Unplanned downtime | The share of time Out of service |
| Maintenance on time | The share of vehicles with no overdue maintenance |
| Inspections on time | The share of vehicles with no overdue inspections |
| Incidents per 100,000 mi | The number of incidents per 100,000 miles driven |
| Fines | The total of fines with a violation in the period, except cancelled ones |
| Fines charged back to drivers | The share of fines paid by the company that were charged back to drivers |
A dash instead of a number means there is nothing to calculate: for example, Maintenance on time shows a dash when the Maintenance module is off, and Fines charged back to drivers when the company paid no fines in the period. A zero is a real zero.
Tables
Section titled “Tables”Below the tiles are a chart and breakdown tables:
- Costs by category: what the total cost is made of: “Fuel and charging”, “Repairs and maintenance”, “Insurance, tax and registration”, “Fines”, “Other”, “Depreciation”.
- Most expensive vehicles: the ten vehicles with the highest cost of ownership in the period and their cost per mile.
- Consumption: norm and actual: average fuel or electricity consumption between full tanks against the norm, by vehicle class and energy type.
- By class: costs and distance by vehicle class.
- Most time off the road: the ten vehicles that spent the most hours in the shop or out of service.
- Low utilization: vehicles with utilization below the threshold in the fleet settings (30% by default).
- By group: costs and distance by vehicle group.
- Drivers: incidents and fines: the drivers with the most incidents and fines, and the total of their fines.
- Replacement candidates: vehicles whose repairs over the last 12 months cost more than 3% of their price, or that are older than the replacement age in the fleet settings (8 years by default). The Why column shows the reason. This table always covers the last 12 months, whatever period is chosen.
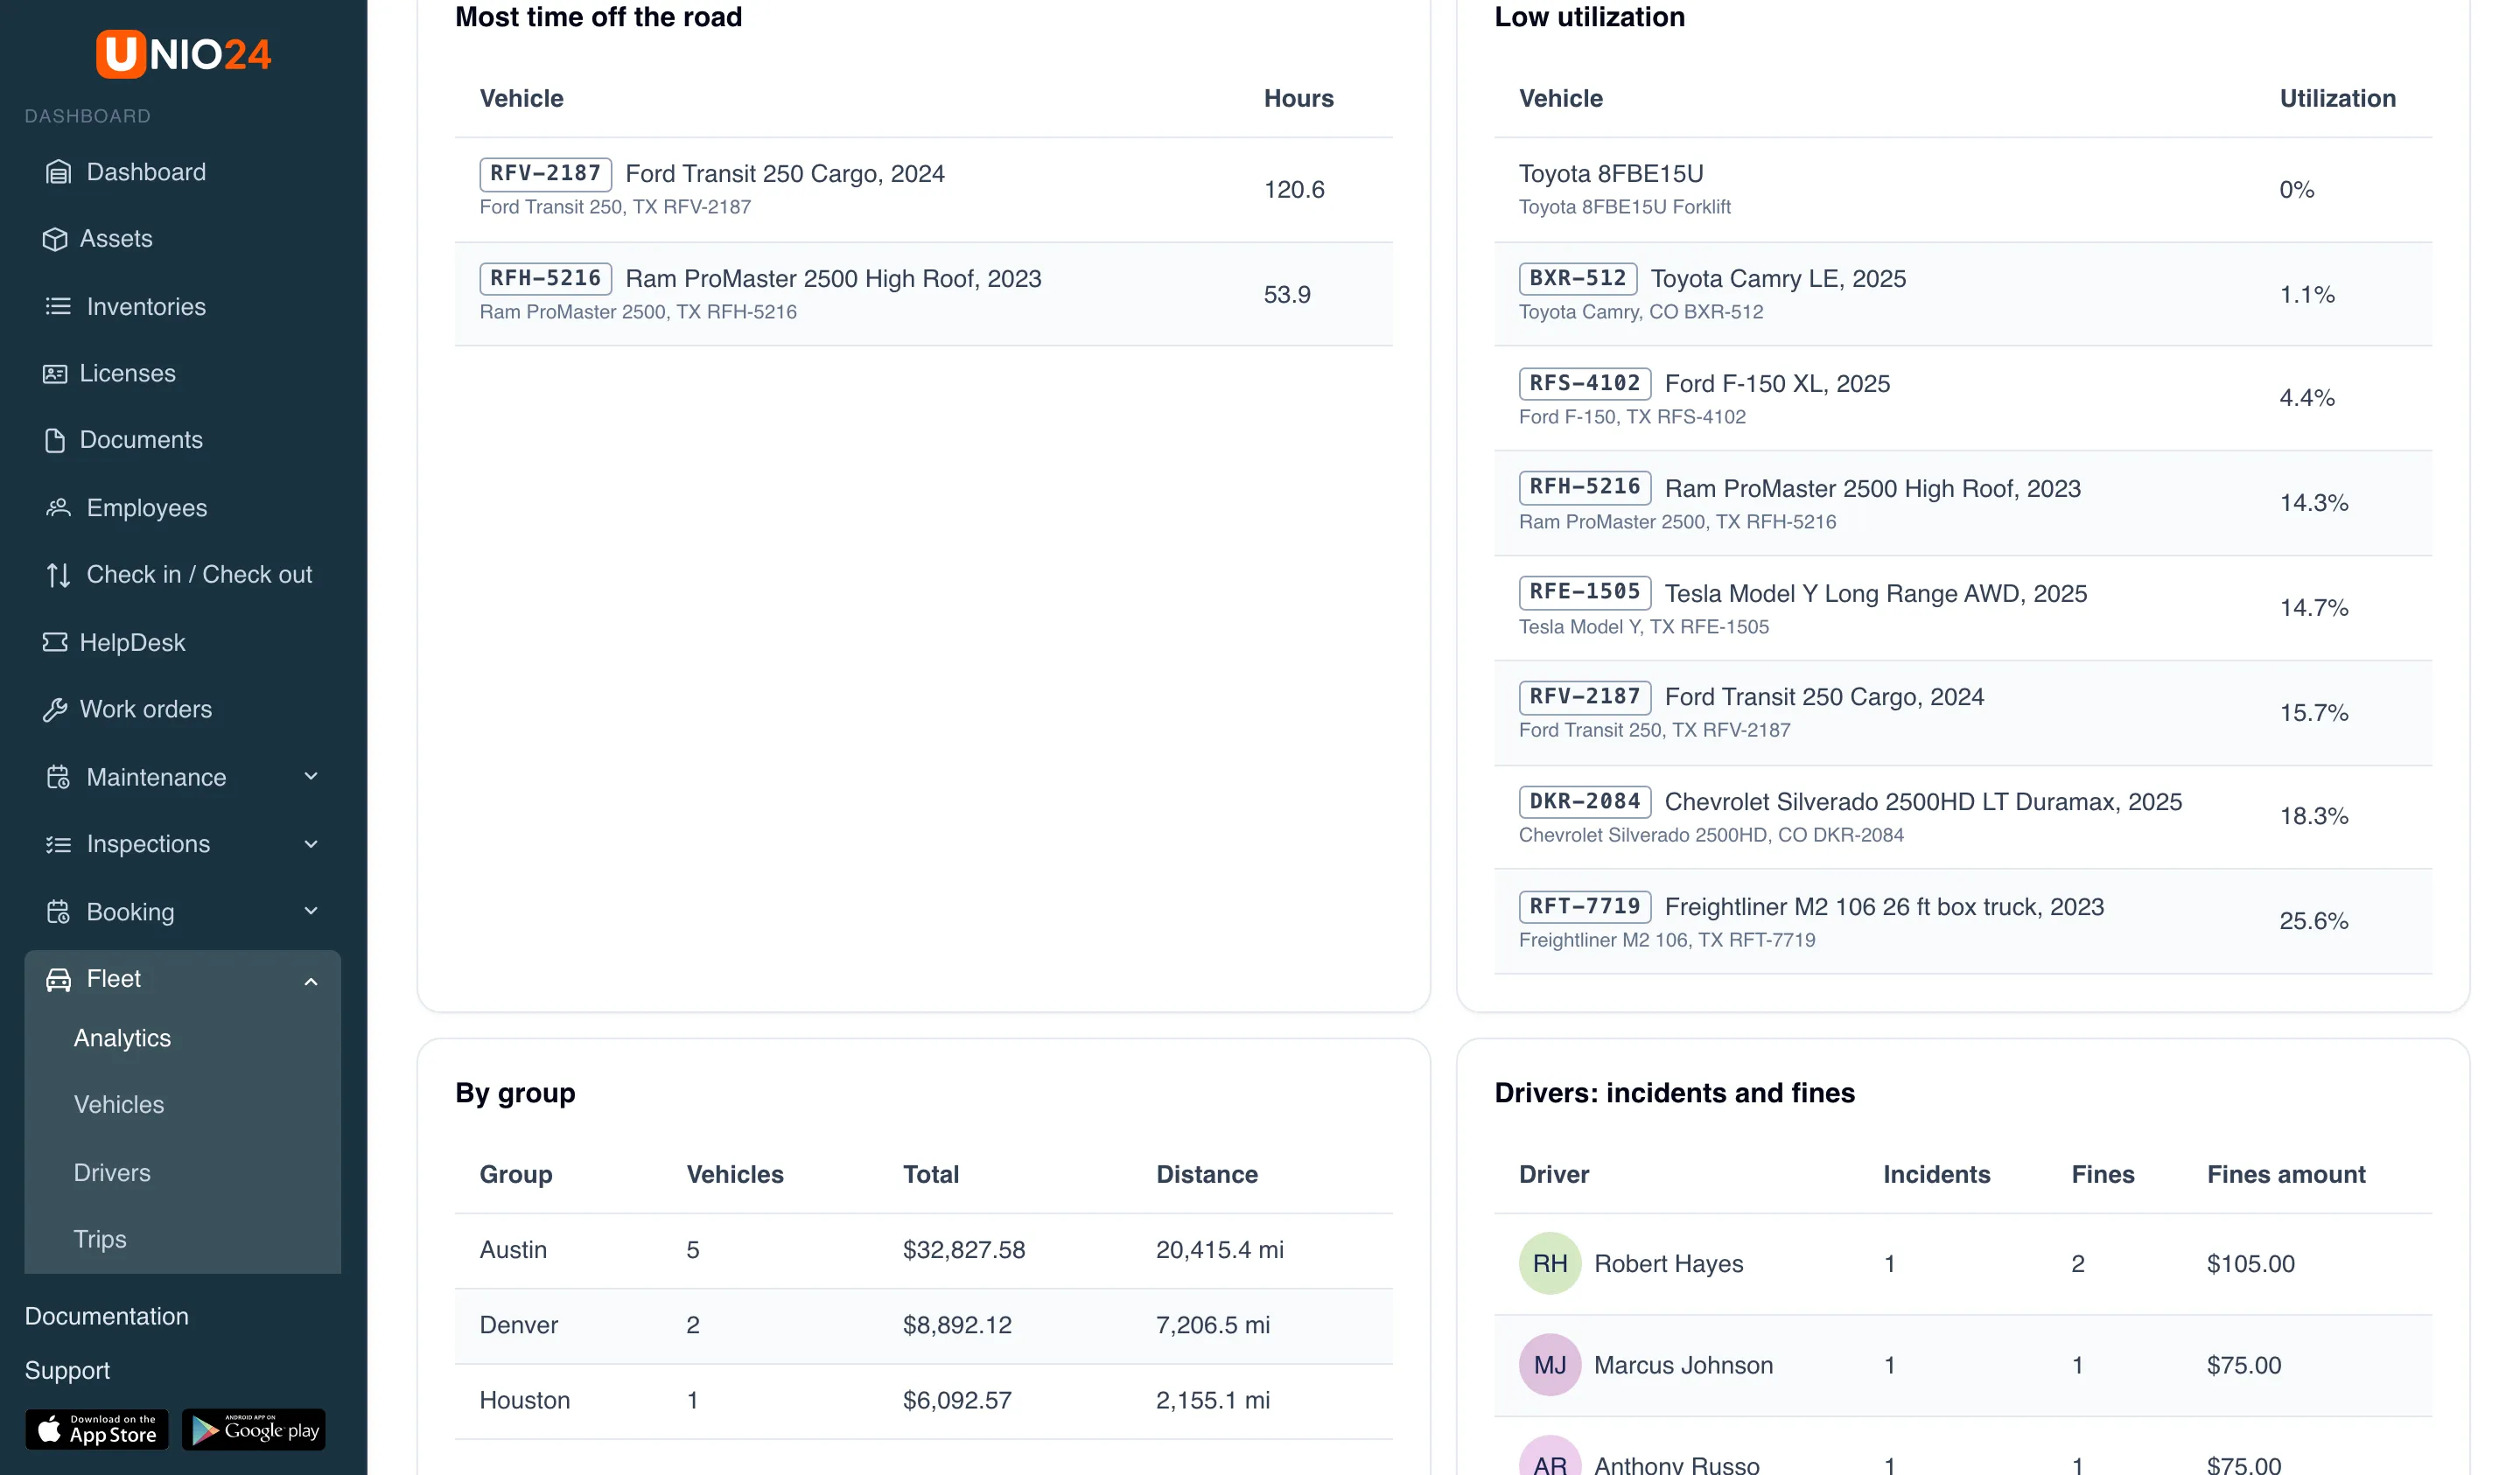
Clicking a vehicle or driver in a table opens their card if you’re allowed to open it; otherwise the name is shown as plain text.
Amounts in another currency
Section titled “Amounts in another currency”Money on this page is counted in the company currency. Expenses and fines recorded in another currency aren’t added to the totals; instead, a note appears under the tile or in the table row, for example “Fines in another currency not included: 1” or “Records in another currency not included: 2”.
What is counted
Section titled “What is counted”Analytics counts today’s fleet: vehicles that are currently marked as vehicles and not written off. If a vehicle is written off, its costs and distance for past periods leave the analytics too.
The low utilization threshold and the replacement age are set on the Analytics tab of the Settings → Fleet page; see Configure fleet.
IFTA report
Section titled “IFTA report”IFTA (International Fuel Tax Agreement) is the quarterly fuel tax report that motor carriers in the United States and Canada file: the miles driven and the fuel bought in each state or province by qualified vehicles. UNIO24 prepares the miles and gallons for the return. It doesn’t apply tax rates or file the return: you do that on your state’s portal.
The IFTA item is in the Fleet menu only for companies in the United States and Canada. It’s visible to users with “View vehicles, fuel entries and trips”, “Manage vehicles”, or the fleet “Analytics” permission.
Open the report
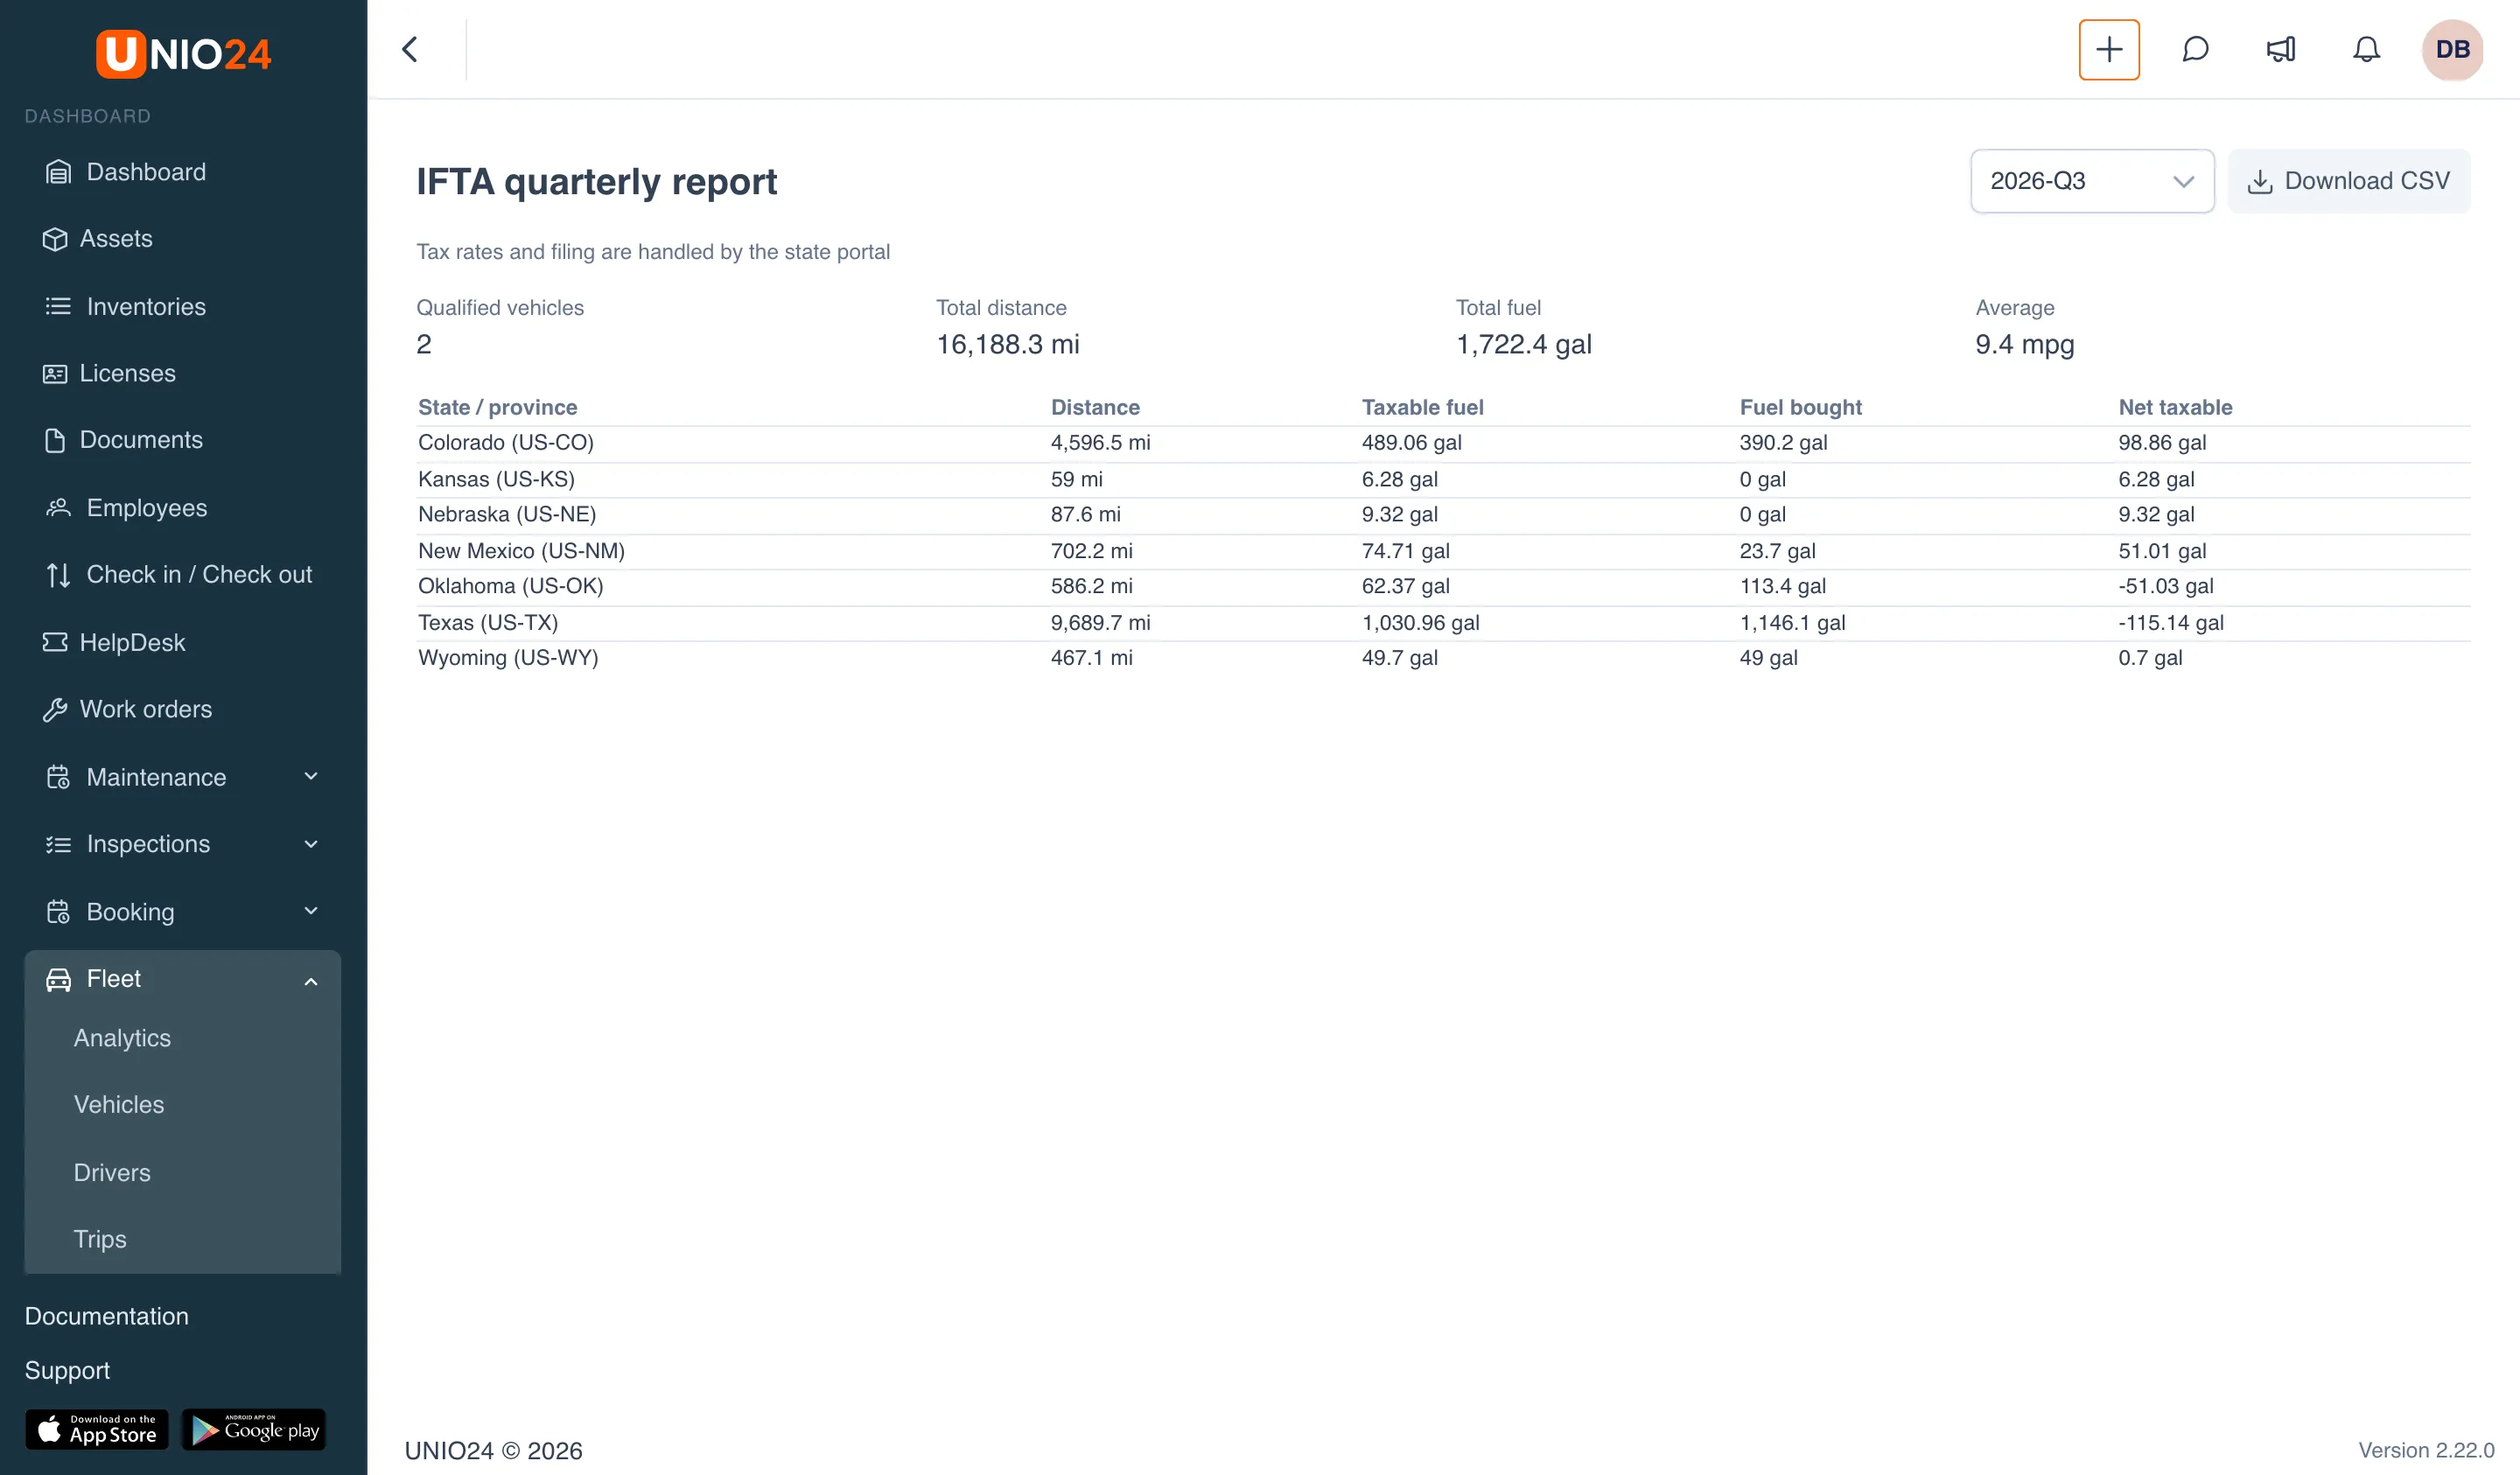
Section titled “Open the report”- Open Fleet → IFTA. The IFTA quarterly report page opens for the current quarter.
- Choose a quarter in the list at the top right, for example 2026-Q3. The last eight quarters are available.
Read the report
Section titled “Read the report”At the top are the quarter’s totals:
- Qualified vehicles: the vehicles that were IFTA-qualified at any time in the quarter;
- Total distance and Total fuel: miles and gallons of those vehicles for the quarter;
- Average: the fleet’s average fuel economy (mpg for a US company, km per liter for a Canadian one).
The table has one row per state or province:
| Column | What it shows |
|---|---|
| State / province | The jurisdiction and its code, for example “Texas (US-TX)”. Alaska, Hawaii, the District of Columbia, and the Canadian territories are marked not an IFTA member: their miles count toward the average, but they aren’t taxed |
| Distance | Miles driven in the jurisdiction |
| Taxable fuel | Distance divided by the fleet’s average economy: how much fuel the miles in this jurisdiction used |
| Fuel bought | Fuel bought in the jurisdiction |
| Net taxable | Taxable fuel minus fuel bought. A negative number means more fuel was bought there than used |
If some data is incomplete, warnings appear under the table: Distance without a state breakdown, Fuel without a state, and Trips without a state breakdown. They mean some trips or refuelings of the quarter don’t say where they happened yet; fill in the states and open the report again.
Where the numbers come from
Section titled “Where the numbers come from”- Vehicles. Only vehicles with the IFTA-qualified (over 26,000 lb or three or more axles) checkbox count; you set it in the vehicle data (see Vehicles and drivers). UNIO24 doesn’t check the weight or axles: whoever checks the box is responsible for the criterion. Equipment measured in engine hours isn’t included. A trip or refueling counts if the vehicle was qualified when it happened: checking the box on August 1 brings only August and September into the third quarter, and unchecking it after the quarter doesn’t change that quarter. A vehicle deleted later keeps its miles and gallons in its past quarters.
- Miles. From closed trips that started in the quarter (by the company’s time zone). Each trip is split by state in the Distance by state / province section when it’s closed or corrected; see Fuel, trips and expenses. Open trips aren’t counted.
- Fuel. From refuelings of the quarter, by the State / province field of the refueling or the state column of an imported fuel card statement. Only liquid fuel counts: EV charging, CNG, and AdBlue aren’t included.
The report is in the company’s units: miles and US gallons for a US company, kilometers and liters for a Canadian one.
Download the report as CSV
Section titled “Download the report as CSV”Click Download CSV. The file has a row per jurisdiction with the “Jurisdiction”, “Name”, “IFTA member”, “Distance, mi”, “Taxable fuel, gal (US)”, “Tax-paid fuel, gal (US)”, and “Net taxable fuel, gal (US)” columns, followed by the quarter totals and the three incomplete-data counters. Use it to fill in the return on your state’s portal.
Fleet widgets on the dashboard
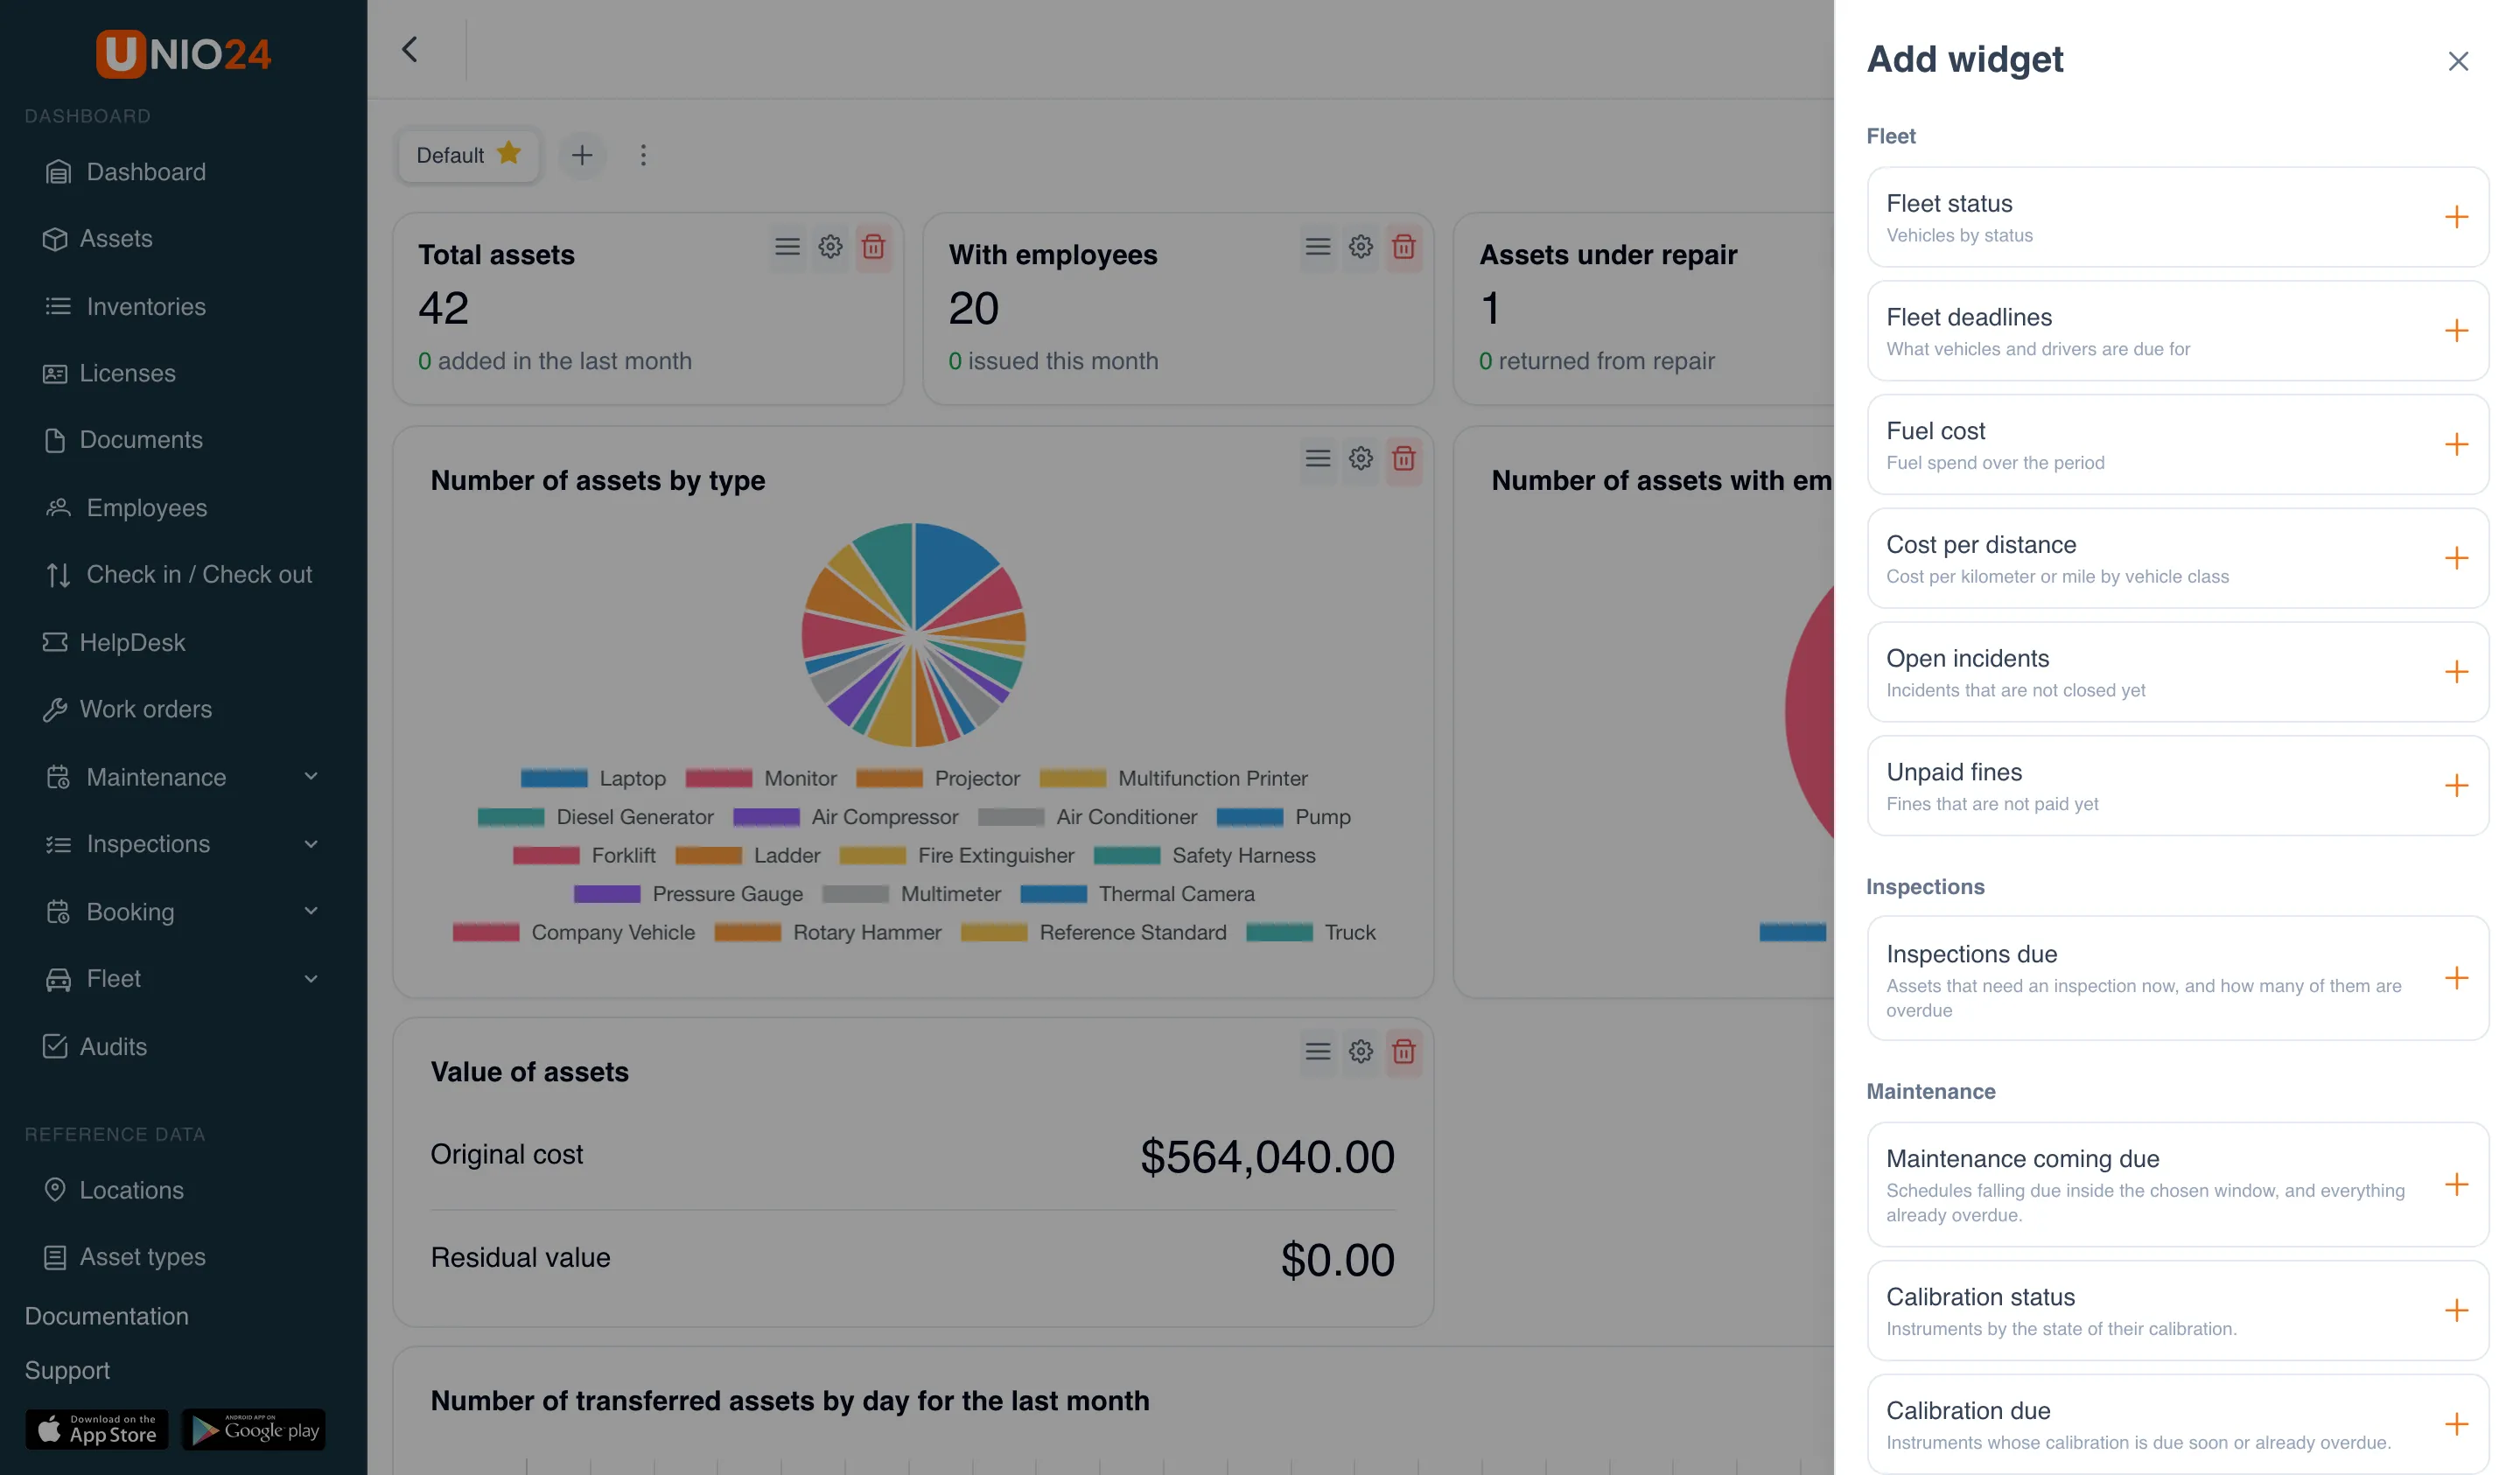
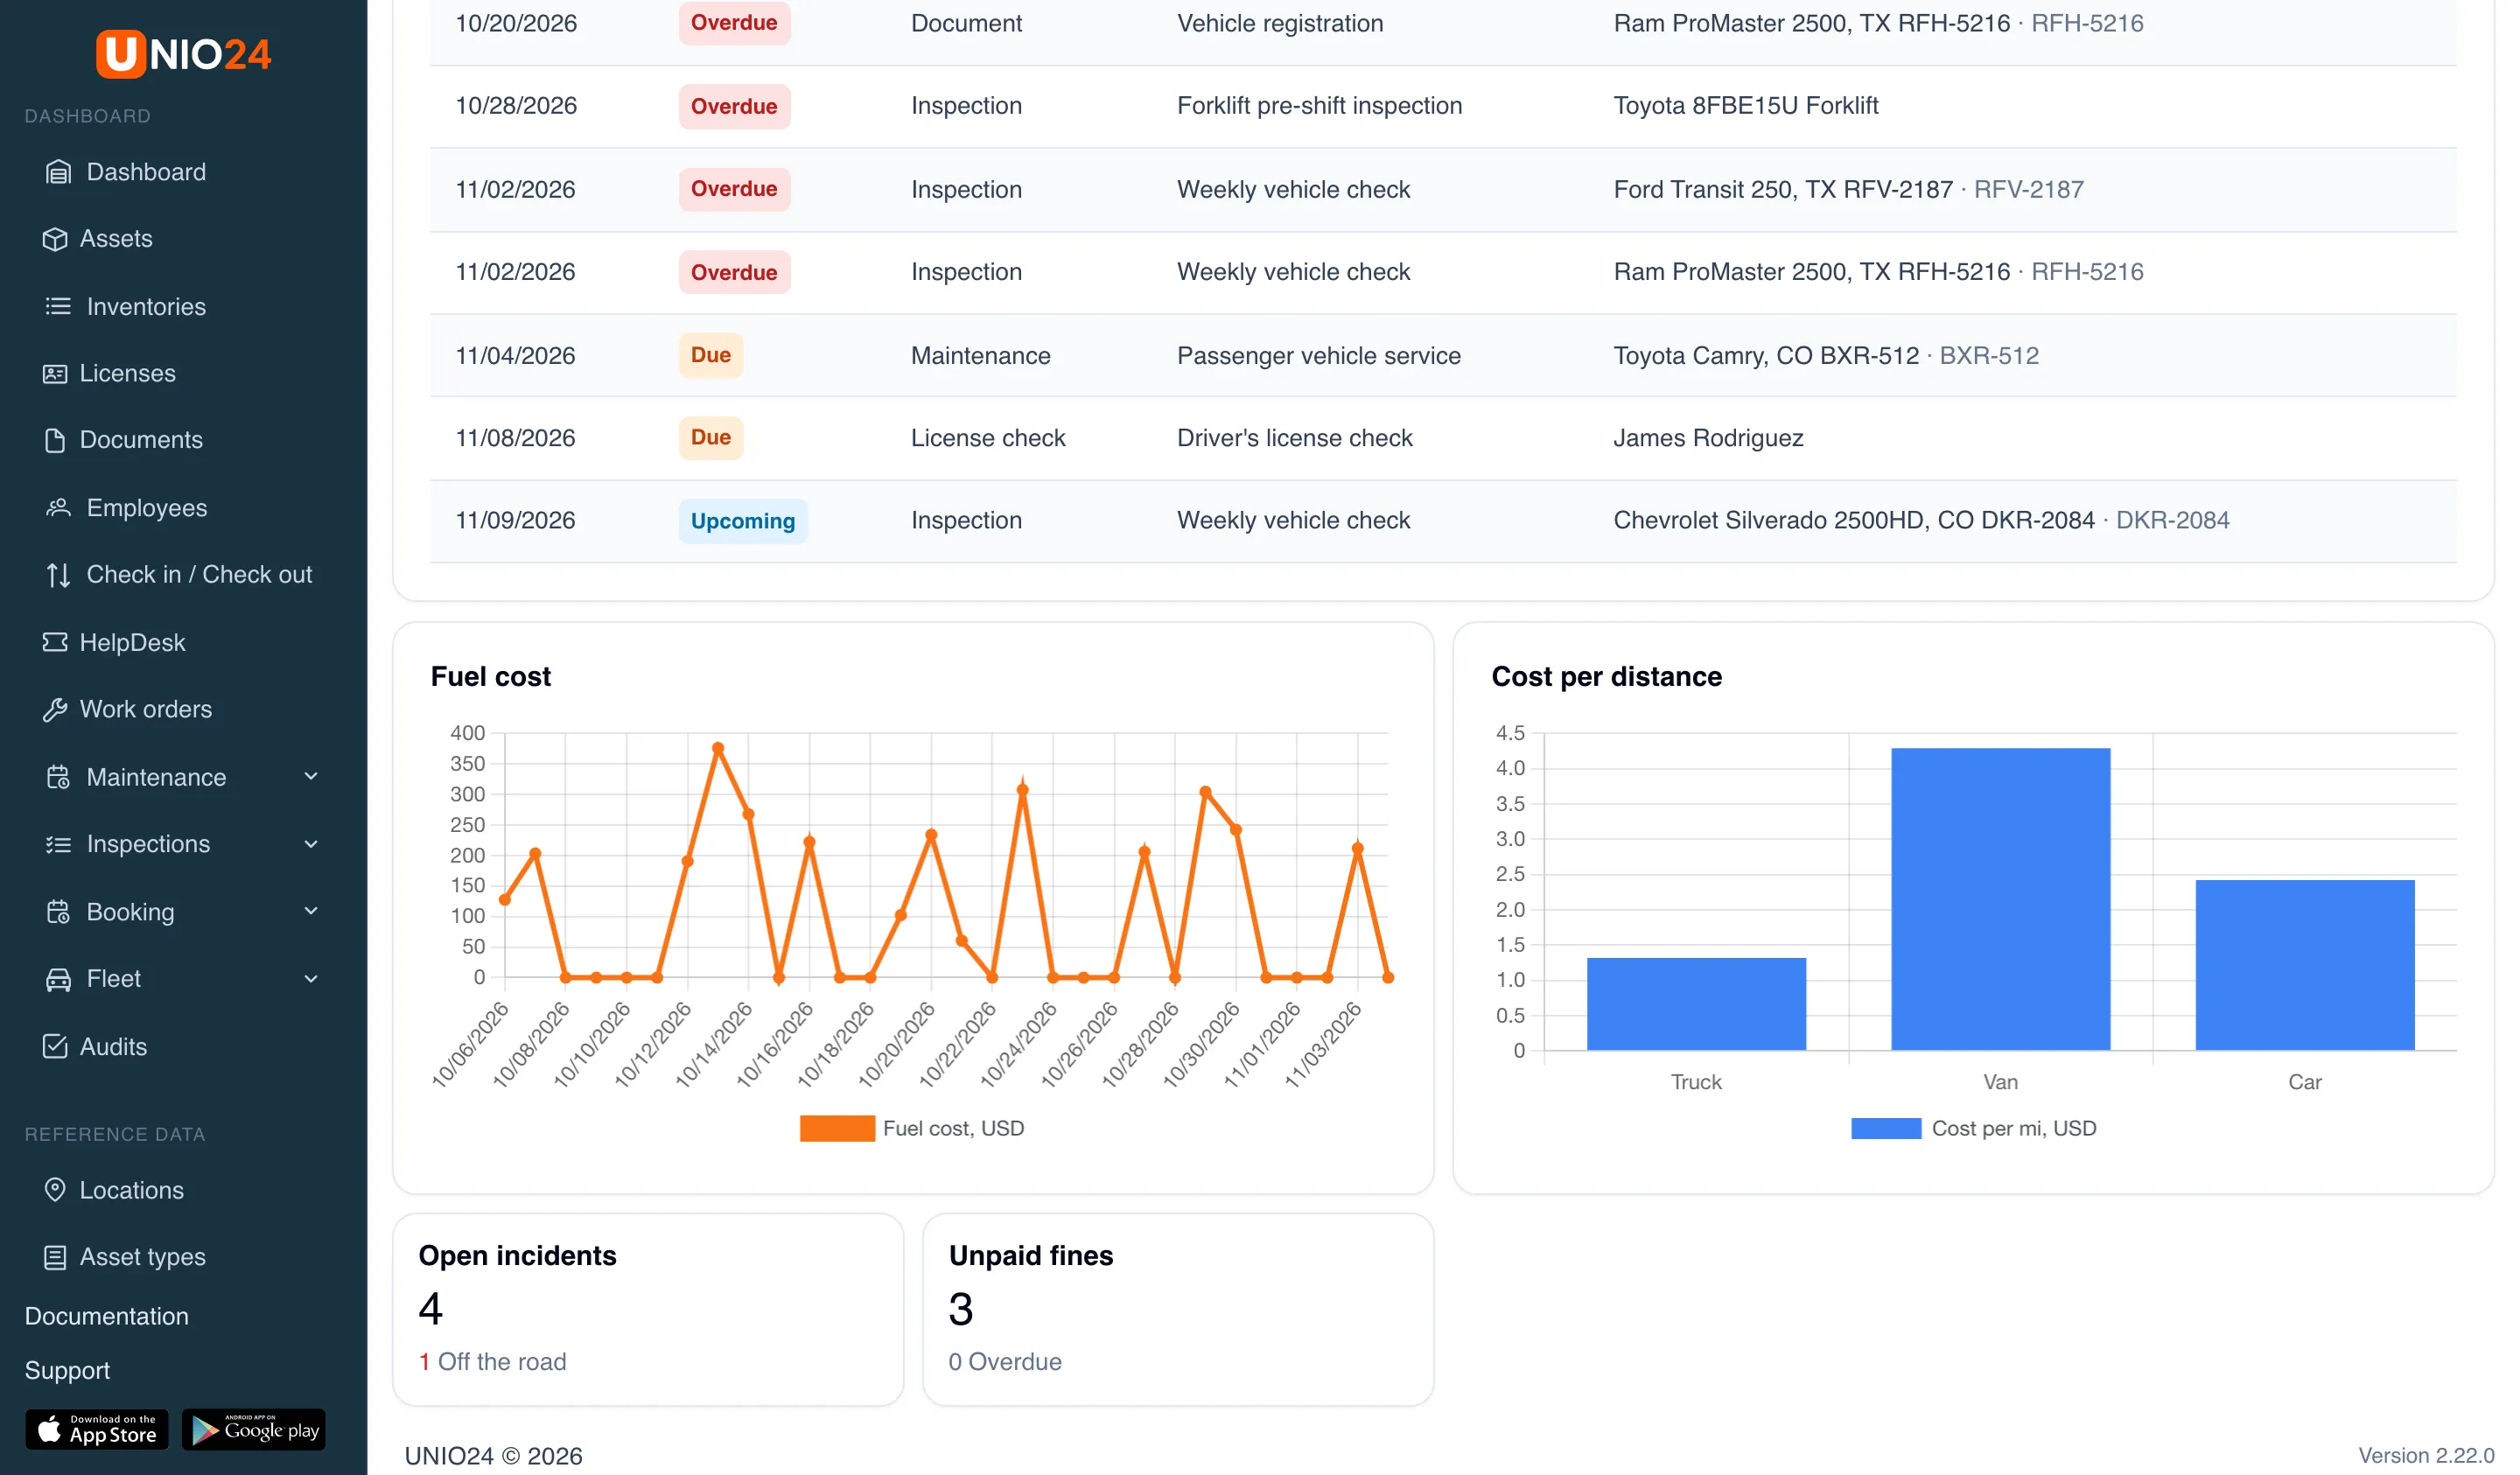
Section titled “Fleet widgets on the dashboard”You can add six widgets of the Fleet category to the dashboard:
| Widget | What it shows | Who can add it |
|---|---|---|
| Fleet status | Vehicles by status: “Active”, “In the shop”, “Out of service”, “Inactive”, “Sold” | View vehicles, fuel entries and trips |
| Fleet deadlines | The nearest rows of the Deadlines page, with the same per-section permissions. The widget settings have the number of Rows and Within, days | View vehicles, fuel entries and trips |
| Fuel cost | Spending on refueling and charging over the period, by day, week, or month | View vehicles, fuel entries and trips |
| Cost per distance | Cost per mile (or kilometer) by vehicle class for the period | View vehicles, fuel entries and trips |
| Open incidents | The number of incidents not closed yet and how many of them leave a vehicle off the road | View incidents or Manage incidents |
| Unpaid fines | The number of unpaid fines and how many of them are overdue | View fines or Manage fines |
To add the widgets:
- Open Dashboard and click Configure.
- Click Add widget and find the Fleet section in the catalog.
- Click the widgets you need: each one is added to the dashboard.
- If needed, open a widget’s settings to choose the visualization, width, or period.
- Click Save.
Clicking a row of the Fleet deadlines widget opens the card of the vehicle or driver.
Useful links
Section titled “Useful links”- Fleet — how the module works
- Configure fleet — the low utilization threshold and the replacement age
- Fuel, trips and expenses — trips split by state and refuelings that feed the IFTA report
- Fleet reference — permissions, statuses, and notifications
- Dashboard — how to set up the dashboard
- Documents — renewing vehicle and driver documents